What is Behavioral Analytics?
Behavioral analytics is a subset of data analytics that focuses specifically on customer behavior. Most companies today use some form of consumer behavioral analytics, which involves tracking and analyzing online interactions with their products or services. This gives them valuable insights into customer actions, likes, and dislikes, which they can use to improve their user experience.
This article explains in detail what behavioral analytics is and how it can help grow your business. We’ll talk about behavioral data as the basis for analytics first, before covering how to do behavioral analytics and what tools to use to ensure the success of your behavioral analytics project.
What is behavioral analytics?
Behavioral analytics is the study of behaviors that customers exhibit online. It involves understanding how customers interact with your company’s products and services by studying patterns and trends in your data and trying to work out why customers act the way they do. The goal of behavioral analytics is to improve customer engagement, retention, and conversions, and its insights allow you to make more accurate predictions of how your customers are likely to behave in the future.
Behavioral data is different from other data collected about customers as it is purely based on actions taken (or not taken) by the customers as opposed to other forms of data, like demographic or firmographic data. Behavioral analytics therefore mostly involves studying customer interactions with your product or service, as this generates a huge amount of useful data that can be analyzed. These interactions can be with your website, email, mobile app, online chat, or IoT-connected product. Every single specific action that a user takes while using your website or app can be recorded as an event. This raw event data is used as the input for behavioral analytics. Event data can even be generated by things that we sometimes wouldn’t think would be recorded as “actions,” such as when a user moves their mouse, or how long they hold their cursor over a particular spot on the screen before moving it.
What is behavioral data?
Behavioral data is generated when a customers’ interaction with a product or service is measured. This event data can come from many places including websites, mobile apps, CRM systems, help desks, billing systems, and social media. To be useful, however, it needs to be collected, transformed, and loaded into one place so it can be easily queried.
Behavioral data refers to raw event data that is captured about a customer. It includes events such as "customer A clicked on button X," "customer B opened web page Y at timestamp J,” "customer B closed web page Y at timestamp K," or “customer C liked social media post Z”.
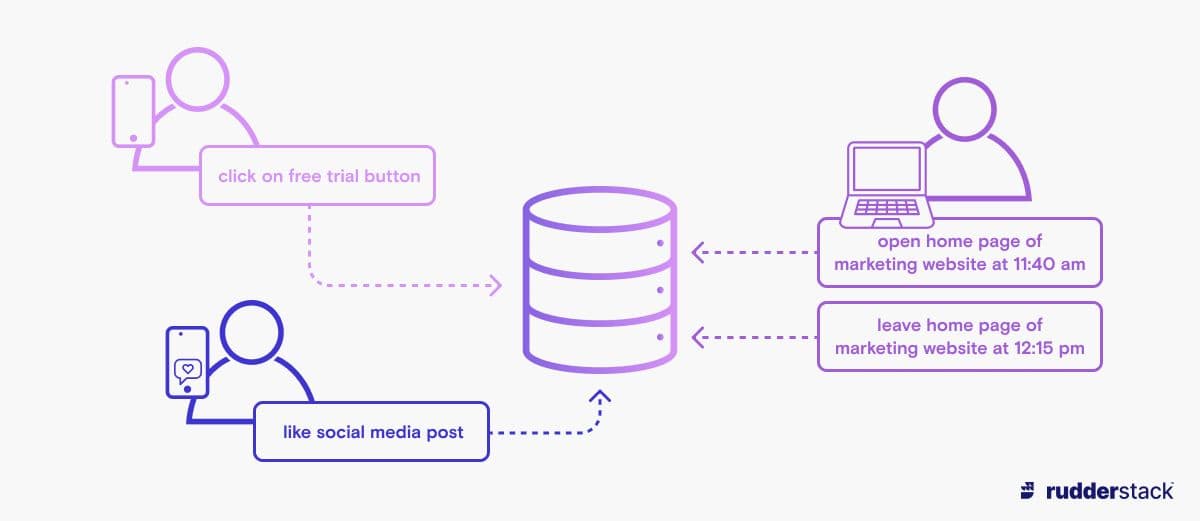
These events can later be transformed into meaningful data points about a customer, such as the time they spent on your website or the number of times they liked your content. Behavioral data differs from engagement data, which is focused on customers interacting with your business as a whole, rather than specific actions taken in relation to your product or service.
Why is behavioral analytics important?
Behavioral analytics takes the individual data points that were generated through your customers’ use of your product, and aggregates and transforms them into a coherent story of how and why your customers act in particular ways. Using analytics techniques, you can then predict your customer’s future behavior and gain insights into their pain points and desires and what might improve the user experience for them. These insights can inform your strategy for improving relationships with current and potential customers, and improve your ability to offer a personalized service, as you may choose to group your customers into different segments based on shared characteristics or interests. They can also help you to work out ways to improve your customers’ perception of your brand, leading to improved sales and customer retention.
For SaaS companies, one of the most useful questions to ask is “How is the customer using our product?” Behavioral analytics seeks to answer this question. It can also yield rich information about customer interests, which is much more detailed and insightful than simple demographic data. Not only is behavioral data easier to collect than specific customer feedback, but the analytic results it produces can also provide more honest information about what a customer really wants than if you asked them directly, making it an especially useful confirmation step for the “gut feeling” of a marketer, product manager, CSM, or executive.
Your marketing team can use behavioral analytics to better understand which part of your product your users are spending the most or the least time on, therefore allowing for more targeted and impactful campaigns. For example, if your analytics finds that a new feature of your product is not getting used, your marketing team could run a campaign highlighting this new feature, or your front-end developers could place it more prominently within the product.
Finally, behavioral analytics is useful for identity resolution: the process of linking data points together to create a complete picture of a person. Sometimes, an identity cannot be determined with complete certainty, and you have to rely on using predictive algorithms to match two data points as being linked to a single person, not with complete accuracy, but with a statistically acceptable level of confidence. The algorithms will look at matching IP addresses, operating systems, MAC addresses, and similar timestamps, and will take all available information into account before determining if two records match. This type of fuzzy matching is called “probabilistic identity resolution.”
How to do behavioral analytics
Behavioral analytics mostly involves following standard data analytics techniques to track behavioral data, but you can also make use of behavioral analytics tools to capture more comprehensive or unusual behavioral data. Following the steps below will help guide your behavioral analytics practice.
- Choose goals: Decide on your company key performance indicators (KPIs) and business goals. This will provide context to the questions you want to ask about customer behavior.
- Choose the behaviors you want to track: The reasons for tracking any behavior should always be linked to your company goals or KPIs, as it is easy to be misled by data that seems interesting but does not help provide business value. Once you have decided on the behaviors you want to track, ensure you are either recording this information yourself or using an appropriate third-party behavioral analytics tool to do so.
- Use behavioral segmentation: Segmentation is a marketing term that means grouping your customers together based on shared characteristics — for example, geographic location, gender, or behavioral segmentation (customers who have taken action X), also known as cohorts. Behavioral segmentation focuses on grouping together customers with shared behaviors, which can be useful for providing personalization, predicting future behaviors, or identifying high-value customer segments.
- Perform exploratory data analysis (EDA): Explore your data to see if any interesting information or anomalies can be found. This can guide how you decide to clean your data, and can also guide you when deciding on which questions are useful to ask. EDA can be done manually or using automated clustering processes.
- Choose questions: Formulate the questions you want to ask based on your business goals. For example, you might ask “What were the behaviors customers were doing on your website right before they upgraded to the premium version?”
- Conduct data analysis: Data analysis is a way of finding answers to your questions. Some common types of analysis when looking at customer behavior include diagnostic analysis (understanding why a customer behaved in a particular way) and predictive analysis (predicting how a customer is likely to behave in the future). Data analysis can be as simple as writing an SQL statement to query your data until you find the information you need, but can also include more complex types of statistical analysis or even machine learning. If you want to run regular reports using the same analysis, you can use data analytics to set up a pipeline to report your answers on a regular basis. In this case, it’s a good idea to follow the data analytics lifecycle.
Read Five Ways To Shorten Time To Value for Your Customer Engagement Data for more insights on how to get the most value out of your behavioral analytics.
Behavioral analytics tools
Behavioral analytics tools can help you with your analytics project for two main reasons. First, some of the event data that you will need is not data that websites or applications tend to capture (for example, the position of your customers’ cursor at any given time), and it can be simpler to use software that is already set up to capture this type of data. Second, behavioral analytics tools often have certain analytics methods or data visualizations built into them and are inexpensive, so they are easy to get started with and don’t require asking a developer for changes to the information they track on your website.
Behavioral analytics tools tend to fall into a few distinct categories. There are tools that focus on watching the customers’ behavior (in real-time or after the fact), tools that ask the customer for feedback, and tools that track whether newly-added features are leading to improvements in conversions or other measurable organizational goals. Some of the most common tools are explained below.
A/B testing tools: A/B testing lets you gauge whether the changes you have made to your application are effective by conducting an experiment. For example, you may want to know whether a redesign of a particular web page is a good idea, so you can create a second version of your page with the redesign on it, for comparison. A/B testing software randomly routes half your traffic to version A of your page and the other half to version B, and allows you to see which version performs better. You can measure whether desirable outcomes such as the conversion rate, click-through rate or share rate have increased for the group seeing the changed version, allowing you to work out whether your change is effective or not. Before conducting A/B testing, you should first develop a hypothesis about what you expect to happen, which will help to guide your research.
Session replay tools: Installing session replay tools on your app or website allows you to take video recordings of what your customer is seeing on your website in real-time, along with certain actions they perform on your site such as scrolling, clicking, or moving their mouse. These recordings are then stored for later viewing — however, you should get the consent of your user to track them in this way. The qualitative data supplied by session replay tools can be used in addition to your quantitative event data to provide further insight into things like why certain pages of a website are less successful than others when it comes to sales or sign-ups. Watching a few customers interact with the page in real time might help you notice things like your customers scrolling past an important call to action button, or browsing a product page for a long time without completing a sale. Session replay tools are most useful when applied in a very targeted fashion. For example, once your EDA has shown that customers seem to be having larger than expected drop-offs at a particular step of your funnel, using session replay tooling on that page / module can potentially show you why customers are struggling.
Heat map software: Heat map software displays a visual representation of the features that a user interacts with on your website or app. It reveals which parts of the page the customer interacts with the most (using hot colors such as red) and the least (using cold colors such as blue). This information can be really useful if you’re considering a site redesign.
These tools are most effective for web pages whose structure doesn’t change as the user interacts with it. Heat maps tell you if a user interacted with a certain spatial point of your UI (for example, the point that is 300 pixels across and 450 pixels down). Pages that change their structure by dynamically loading new sections based on user activity (for example, pages with accordions) will be harder to analyze with this method. This is because a heat map is overlaid over a screenshot of how your page looked at initial page load.
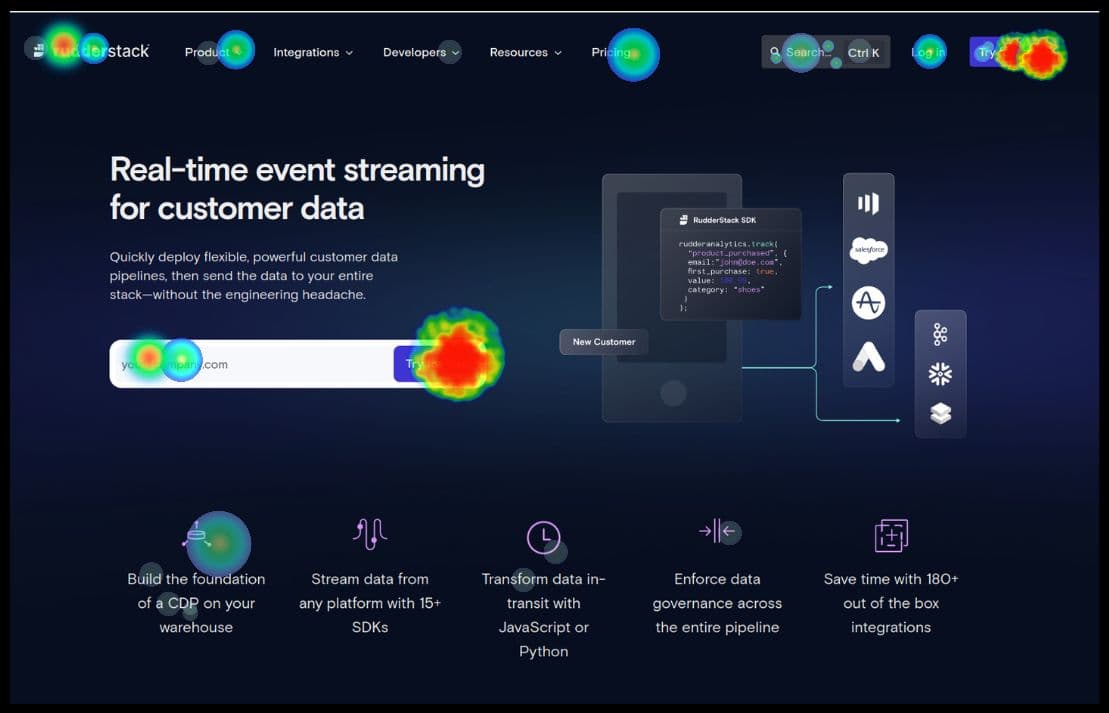
A heat map shows which areas of the website are most commonly clicked
Voice of the customer (VoC): This is software that you install on your website that causes a chat box to pop up asking the customer to fill in a short survey (often just asking them to answer a single multiple-choice question). This can allow companies to find out more information about their customers’ wants and needs than capturing raw event data can tell them. A common market research metric that can be used in a survey such as this is the net promoter score (NPS), which simply asks “How likely are you to recommend this to a friend or colleague?” and gives a scale of 1 to 10. Depending on whether the user gives a high or low rating, different followup questions can be asked.
Conclusion
Behavioral analytics is the study of how customers interact with your online product or service, and is a part of data analytics. It allows you to study behavioral data from your application, which is raw event data of all the different actions a user has performed on your application. You must decide which data you want to record, and whether it’s reasonable to record these events in an audit log on your website, or whether it’s more sensible to use a third-party behavioral analytics tool. For example, session replay and heat maps record a huge amount of data (an entire video of your customers’ interaction, or every movement of the mouse, respectively) so it’s generally more sensible to use a third-party tool to record these types of data. You can use behavioral analytics to better understand your customers, and to generate insights into the reasons for your customers’ behavior, as well as to predict how they might act in the future.
The insights gleaned from behavioral analytics can help you work out if your application would benefit from personalization features, and what features you should add to your site next. This can inform your business strategy for increasing customer engagement, fine-tuning your products, and improving the customer experience.
The tools and methodologies in this article can help you with your behavioral analytics practice, whether you are just getting started with analytics or if you are more experienced. There are a wide variety of behavioral analytics tools that are cheap and easy to use – they generally require less technical know-how than other data analytics methods, so you can easily pick a tool and get started with your behavioral analytics journey.