Quantitative vs. Qualitative Data
The data your business collects for analysis and research will fall into one of two categories — quantitative or qualitative. This article will explain what quantitative and qualitative data are, what the difference is, and how each can be used in your business.
What is quantitative data?
Quantitative data comprises numbers — measurable (quantifiable) values. This includes data like the number of visitors to a website, a person's age, and how many years they have been a customer of a business.
Quantitative data takes its meaning from the numerical values in the data — the numbers are the information, and are not just representational labels. The numbers refer to a magnitude, or sometimes an order.
Quantitative data answers questions such as ”How much time do visitors spend on my site?”, ”How often do customers make a purchase?” and ”How many users does each advertising channel attract?” The answer to each of these questions is a measurable, numerical value.
Quantitative data examples
Much of your core business data will be quantitative — from your sales figures and finances to your raw analytics data collected from your users. Examples of how quantitative data is used in business include:
- Statistical analysis: Sales data can be analyzed to find out what product variations sell best, so that product offerings can be kept up to date with changing customer demands.
- Determining what has happened: Activities of your user cohort, such as their level of engagement with your app, can be tracked, and changes over time can be identified. If you also have qualitative data (see below), these changes can be correlated with it.
- Predicting future trends: Historical data can identify past trends that may repeat in the future — seasonal variations, for example.
Quantitative data lends itself to use in descriptive analytics — the interpretation of real-time and historical data to understand real-time customer behavior.
What is qualitative data?
Qualitative data uses language to categorize or describe something, often subjectively. This includes data like a visitor's opinion of your website, a customer’s interests, and the reasons they continue to patronize your business.
Qualitative data cannot be organized or labeled numerically in a meaningful way. For example, a user's favorite color has no numerical meaning or precedence. While it could be assigned an arbitrary numerical value (1 = blue, 2 = red, 3 = yellow, etc.), those values have no real meaning in relation to each other in regard to ranking, precedence, or magnitude.
Qualitative data can be analyzed to provide answers to questions such as “Why do customers leave my website before making a purchase?”, “How do customers perceive my brand?” and “What demographic does my product attract?”
Qualitative data examples
The data you collect about your audience and customers is likely to be qualitative. It is collected as user profile information, feedback through direct consultation, reviews, and support channels, as well as questionnaires and paid focus groups. Examples of the use of qualitative data in business include:
- Determining user demographics: A customer's location, gender, and occupation are all qualitative data that describes or categorizes them, and this data is valuable for marketing strategies.
- Gauging customer satisfaction: Customer feedback is often more than a score out of ten — descriptions of their feelings when using your product, or specific problems they have with it, are all qualitative data useful for product improvement.
- Determining why something has happened: If a change in user behavior is detected using quantitative data, the reason may be found using qualitative data.
- Categorizing quantitative data: Quantitative datasets can be summarized by categorizing them. For example, customers who use your app 10 times or less a day may be categorized as infrequent users, whereas those who visit more than 10 times a day are categorized as frequent users. This is especially useful when performing regression analysis — a user’s demographic data can be transformed into a set of binary or boolean columns like “Is North American: true / false” or “Is over 30: true / false” so that the impact of those variables in the cohort can be more easily identified.
Qualitative data is useful in diagnostic analytics — trying to determine why something happened. This should follow descriptive analytics (finding out what happened), as audience feedback can help uncover the reason why an event occurred. Qualitative data is also often used in data preparation for data science-related workloads.
The difference between quantitative and qualitative data
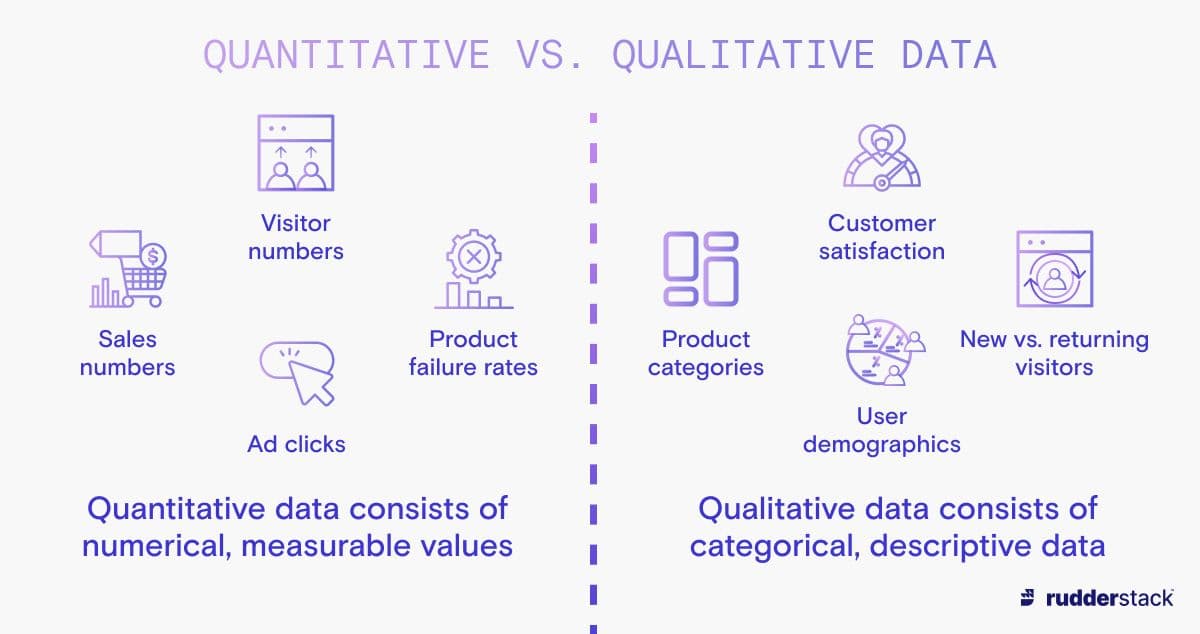
Examples of different kinds of quantitative and qualitative data.
Quantitative data takes its meaning from its numerical values, whereas qualitative data takes its meaning from the language it uses to categorize the information it contains. While each is used for different purposes, they are most often used in combination to build a bigger picture of the data subject.
For example, knowing how many users have visited your website (quantitative data) is useful, but categorizing whether the user is a new or returning visitor (qualitative data) provides a more actionable insight. As such, qualitative data is often used as dimensions to break down or roll up quantitative data. Using the example of new vs. returning visitors, you can look at the breakdown of new vs. returning as a percentage of total visitors, or one as a multiple of the other (3× as many new visitors as returning) — vastly more informative than just knowing how many visitors there were in total. Any time you want to break down a quantitative measurement by some dimension, you are combining quantitative and qualitative data.
Should you use quantitative or qualitative data?
Neither quantitative or qualitative data is better than the other. The terms describe the nature of the data only — both have their own purposes, and both are powerful tools when collected and applied correctly. Which you collect and use will depend on the question you want to answer and your objectives:
- Quantitative data should be used when objective, numerical data is available. It can be analyzed statistically and will provide the information to drive real-world insights. It cannot tell you why something happened, but it will tell you what happened.
- Qualitative data should be used when you want descriptive information or be able to supplement your quantitative data with more depth. You cannot put a number on “why” somebody feels the way they do about a product, but you can obtain data from them that explains it, and then interpret that data.
A combination of quantitative and qualitative data will provide maximum insight. You can associate measurable data with certain qualitative characteristics, answering questions like “How many more purchases do people of one demographic make than another?” — a question that cannot be answered by its constituent quantitative or qualitative data alone.
Quantitative data best practices
Data analysts use quantitative data to spot patterns and trends. They collect, interpret, and present the data so others can use it to help guide business decisions.
Quantitative data collection best practices
Collecting high-quality data is paramount. No data project can be successful if the data it’s based on is inaccurate. Your data should be consistent and free of errors. For example, the quantity of an invoice line item cannot be negative — this would indicate a problem with either your sales system or your data collection process.
Your data should also be reliable. Data lost in transit may not be retrievable, and gaps and duplication in your dataset could skew the results and lead to decisions being based on a false picture derived from that unreliable data.
How you store your data should also be carefully considered when building your data pipelines. You will want to ensure data persistence is maintained for the data you wish to keep, and that appropriate data retention policies are in place so that you remain compliant with privacy and industry regulations and do not accumulate costly, unnecessary data.
Quantitative data analysis best practices
Quantitative data can be analyzed statistically — looking for trends and patterns in your data, establishing relationships between variables, and creating visualizations to present the results to stakeholders. This will build insights into the real-world effects of data collected from past and present business activities, which can then be used to make predictions and inform future decisions.
Mathematical models can take quantitative data as an input and return a numerical output — for example, “if the price is raised / lowered to X, sales volume is expected to be Y”. This cannot be done with qualitative data: “if we change the color to black, sales will be X” doesn’t make sense mathematically.
Qualitative data best practices
Data analysts can use qualitative data to understand your customers better and use this information to help guide business decisions, including how to improve a service or product, and customer communication. It is important that the data is well understood and best practices are followed so that you can achieve the best outcomes.
Qualitative data collection best practices
When collecting qualitative data, be aware of the dangers of self-reporting — both the collection method and the results are self-selecting and often highly subjective. For example, customers with negative opinions of your product are generally more likely to provide feedback than those with positive opinions, skewing your perception of how your customers overall are receiving your product. This can be mitigated by actively prompting users to leave feedback rather than them seeking out the feedback form only when they have a problem.
Qualitative data is more likely to include personally identifiable information (PII) than quantitative data, so you must make sure that you have consent from your users to collect their details in accordance with regulations.
When acquiring qualitative data, it is likely to be in an inconsistent format — users will provide this information often in their own words, including any spelling and language inconsistencies, and even variations in meaning when expressing sentiments. You will need to decide the best way to store this data depending on the content. For example, focus groups and customer interviews might be most efficiently stored as a transcription, while you may be able to break down less complex data from an online feedback form so it can be stored in a more consistent manner based on the sentiment it contains.
Qualitative data analysis best practices
Raw qualitative data can be compressed into more useful quantitative data for easier analysis. Sentiment analysis converts qualitative data into a quantified approximation using machine learning techniques. While it’s not always entirely accurate, it can be helpful when processing large amounts of feedback or to get an overview of longer-form data collected from interview transcripts. It can turn thousands of individual sentences into quantified classifications that can be assigned ranked numerical values.
Qualitative dataset labeling and subsequent modeling can be correlated with causally linked quantitative data, enriching your quantitative data and multiplying the value of both datasets. An example of this best-of-both-worlds approach is the Net Promoter Score (NPS) — a quantitative overview of a user's opinion can be collected using a 1–10 satisfaction score, while additional qualitative data can be collected through a text field. Clicking on a button to submit a score takes little effort on the part of the user, encouraging feedback and not requiring them to type anything unless they have specific praise or problems to raise. Quantitative scores can be analyzed and correlated with their qualitative counterparts — identifying, for example, if certain words correlate with lower scores, which may point to specific areas of improvement.
Net Promoter Scores are also an example of how data may be converted from qualitative to quantitative and back again. The 1–10 scores can be grouped to categorize them (for example, scores of 1–6 are detractors, 7–8 are passive, and 9–10 are promoters), and then converted back into a quantitative measurement to give an overview of the proportion of your users who fall into each category (30% of your users are promoters, 50% are passive, 20% are detractors). These proportions can then be summed as an overall score (your NPS score is +50, -30, etc).
Bias must be considered when analyzing qualitative data. Both the way the question is asked and the way it’s answered can lead to skewed results. Poorly worded feedback forms can lead users into listing only their complaints and omitting their praise, compounding the fact that people are more likely to complain than praise. Attempts to satisfy a vocal minority could alienate the satisfied (but silent) majority of your users — qualitative data should be interpreted by somebody who understands the customer base so that feedback is not misunderstood.
Using customer data platforms with quantitative and qualitative data
Quantitative and qualitative data, when combined effectively, can help you form a well-rounded and considered view of your business's internal and external activities and enable well-informed business decisions. Marketing, product decisions, and even employee reviews can all be data-driven, ensuring the best performance in all aspects of your business.
The stream events that you collect can contain both qualitative and quantitative data. A customer data platform (CDP) will allow you to collect both kinds of data from a variety of sources, format it, and store it ready for quantitative and qualitative analysis either immediately or in the future.
This example data snippet shows how quantitative and qualitative data can both be present in the output from an e-commerce platform — in this case, in the details of a customer's purchase:
JAVA
Your CDP should enable you to extract the full meaning from the combined quantitative and qualitative data you receive from your e-commerce, marketing, support, and other infrastructure. Your data is unique to your business — so your CDP should provide an expressive language for defining your transformations so that you can build your pipelines to your specifications.
When choosing a CDP, ensure that it supports the data sources you are using. Your CDP should be able to consume, identify, transform, and store both qualitative and quantitative data, while ensuring data quality and reliability.
Additional reading
This article explained what quantitative and qualitative data are, how they are different, and how they can be applied in a data-driven business. To find out more about the data your business can acquire, and how it can be used to enable growth, check out our related RudderStack Learning Center articles: