Data Analytics Processes
Virtually all companies today collect data, not for the sake of filling their data warehouses but to draw insights and conclusions from it. The term data analytics describes the practice of aggregating, transforming, and analyzing data, using methods from statistics, machine learning, and data science.
While data analytics is not an exact science, it’s useful to stick to certain established data analytics processes to make sure that your procedure follows best practices and that your conclusions are sound. This article describes the most common steps in the data analytics process and how to implement them to get the most value out of your data.
What is data analytics?
Data analytics derives insights from data for the purpose of understanding the events, trends, and people behind the data. It’s used to describe and explain the past and present, and sometimes it’s used to predict the future.
The data employed in data analytics is typically unique to your business, deriving primarily from customers’ interactions with your product. It can be complemented by external datasets as well — historical weather data or geodata, for example.
Data analytics answers pertinent business questions and is grouped into descriptive, diagnostic, predictive, and prescriptive categories.
- Descriptive analytics answers simple factual questions about the past or present:
- How many monthly active users do we have?
- How high is the churn rate?
- How often does a user interact with our product every week/month?
- Diagnostic analytics will help you understand causal links:
- Did external event X impact the sign-up rate?
- Why did web traffic decrease last month?
- Did marketing campaign Z increase our trial signup numbers?
- Predictive analytics makes forecasts about the future:
- Can we expect more sales of product Y in the upcoming quarter?
- By how much will the churn rate decrease after we roll out 24/7 support?
- If we change the pricing of plan/product X, how will it affect overall revenue?
- Prescriptive analytics can inform and recommend decisions:
- When should we launch product Z?
- Should we offer a free demo?
- Is pursuing market segment X worthwhile?
The primary purpose behind such questions — and of data analytics as a discipline — is to take a collection of individual data points, which, by themselves, have very little informative value, and transform them into a meaningful story for different stakeholders.
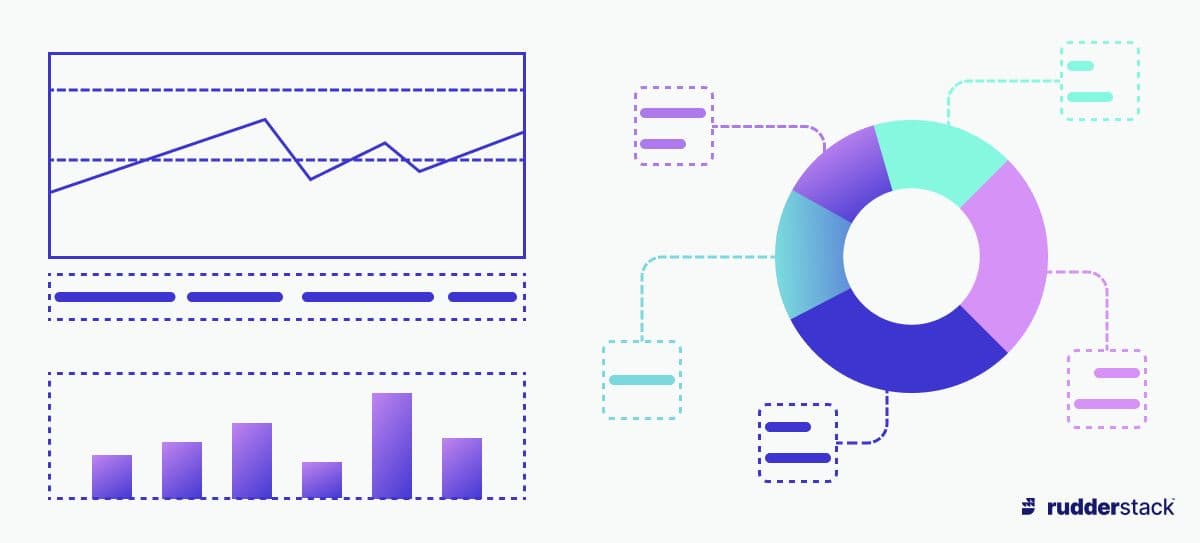
To help craft these “stories,” data analysts often use dedicated tools like Looker, Mode, and AWS Quicksight. These tools also cater to the visual component of data analytics: telling a story is facilitated by graphs and diagrams that serve to illustrate the data analyst’s findings.
Let’s briefly look at a few examples of how data analytics can be used in practice before we dive into the details of the data analytics process.
- Data analytics dashboards: Covid trackers — such as the “Coronavirus dashboard” — are a classic example of how data, when it’s aggregated and contextualized, can produce a meaningful story. A single data point from a hospital doesn’t tell you anything — it’s only when you aggregate the data by region, and compare it to other regions, that you can gain insights.
- Identifying real-world impacts: Data analytics can identify the most successful strategies within a social media campaign — and those findings can then be used to create similarly successful campaigns in the future.
- Spotting unusual trends: In an equally successful, rather quirky example, Spotify used individual, unusual data points (at times combined with cross-product data-driven insights) to advertise its product in an eccentric fashion. To identify such data points within the sea of data that Spotify owns, they used data analytics.
- Understanding your users: Streaming platforms are not only used to consume music, films, or shows that people are already familiar with — one could argue that the core function of streaming services consists in recommending new content. Those services use data analytics heavily to develop and refine their recommendation systems, to make sure folks spend more time on the platform.
What are data analytics processes?
The data analysis itself is only one component of the data analytics process. That’s because data analytics processes are holistic: they encompass the collection, cleaning and documentation of data, as well as interpreting and reporting the results.
It’s useful to talk about the process as a whole because it realistically depicts the actual work of a data analyst. So let’s have a look at the various steps of the data analytics process.
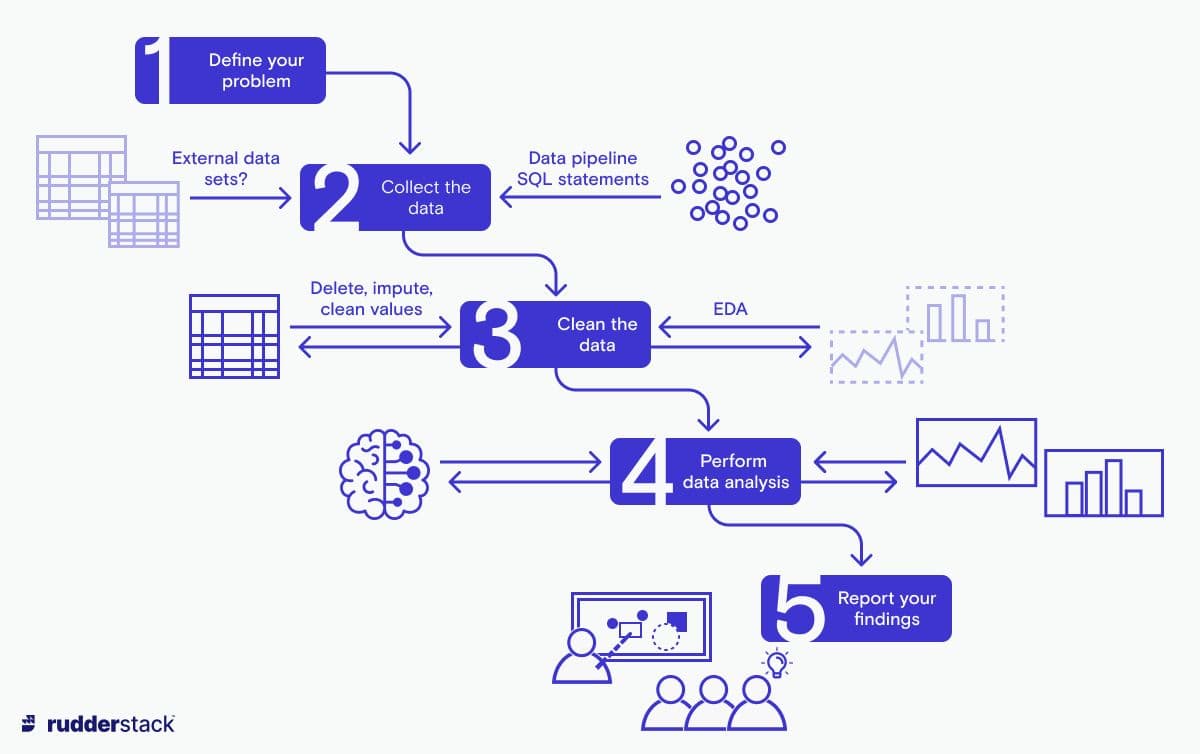
Step 1: Define the problem
Be as specific as possible and clearly define the questions you are trying to answer. Once you know this, you can identify the data required, and the key performance indicators (KPIs) that will measure the success of your analytics project. It’s crucial to get this information clearly defined so that you don’t end up answering the wrong questions.
Depending on the level of data literacy within the company, the questions that a data analyst has to answer may be more or less granular. Often, stakeholders want an answer to very general questions, such as “Why aren’t more people using feature X?” While, business-wise, such a question is entirely reasonable, it is too open-ended for the data analytics process.
The data analyst has to frame the questions in a way that they can be answered with the available data. In our example, that could mean breaking down the general question into a series of more specific queries such as “What percentage of eligible users have used feature X?” or “How do people get to feature X?” However, even these questions show how data analytics has a hard time concretely answering the “why” part of the business user’s question, something data analysts have to be very aware of when communicating results (correlation does not equal causation).
At this step, it’s also necessary to be as specific as possible about the desired results and output. Is the stakeholder looking for a descriptive analysis or suggestions for what steps to take to address a situation? A detailed report or a single number?
Step 2: Collect the data
At this stage, you assemble the data from various sources, which may require the assistance of a data engineer. If external datasets are required for the analysis, you might need to research the best sources for those datasets and investigate how your organization can acquire or buy them.
Step 3: Perform EDA and data cleaning
With your data assembled, you can start to understand what is in it — typically, by performing some kind of exploratory data analysis (EDA). EDA lets you aggregate and visualize your data to gain insights about its distribution. It’s useful to consult a data owner — someone with intimate knowledge of the data’s properties — to help you decide which viewpoints to look at your data from.
Once you’ve gained enough information, you can start cleaning your data. This step ensures that the insights derived from the data aren’t too skewed. For instance, your dataset might contain a suspiciously high number of people allegedly born on January 1, 1980. Most probably, that doesn’t reflect the real data distribution but is merely the default value with which the data entry function was set up.
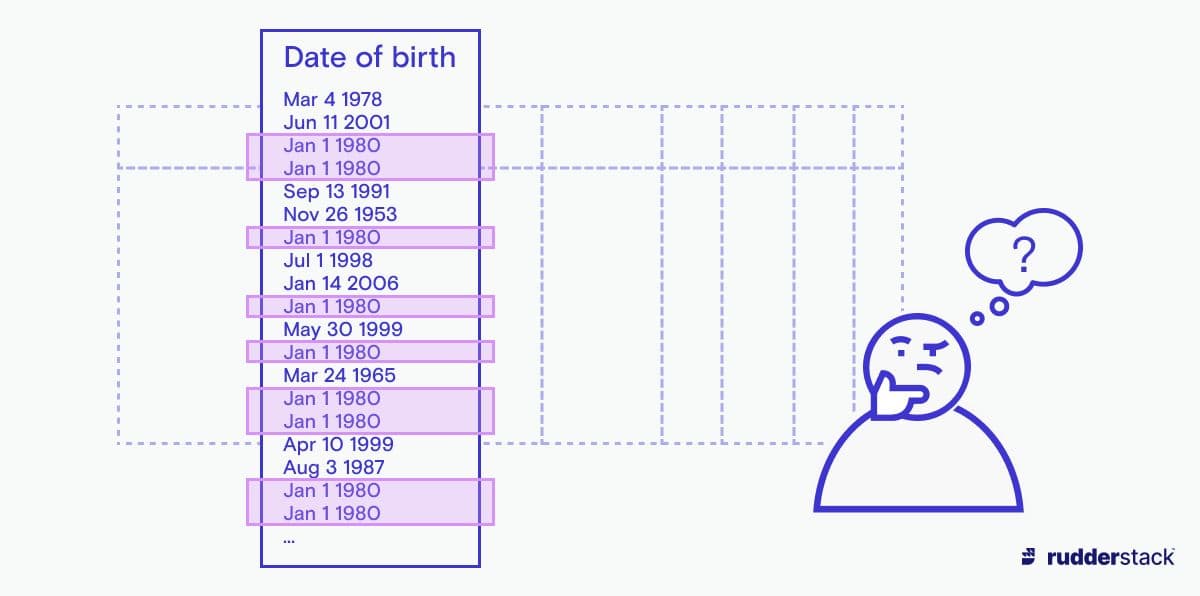
During data cleaning, you’ll want to remove or impute questionable values such as these. Imputation means replacing missing or faulty values with a reasonable substitute. However, be sure to document whenever you remove values or entire data points from your dataset. This serves to: a) make the process comprehensible — to others as well as to future you and b) isolate these “interesting” values from the rest of your data — in some cases, it’s the outliers that your stakeholders might be most interested in!
After cleaning, you might want to do another round of EDA and test whether your data follows a more reasonable distribution now.
Step 4: Perform data analysis
At the heart of the data analytics process lies the actual data analysis. In this step, you analyze your cleaned data. This can range from simply adding a few events into a funnel analysis graph, all the way to performing statistical analyses. These analyses can use either simple statistical models, like logistic regression, or more complex algorithms from the field of machine learning, such as gradient boosting or k-nearest neighbors. Depending on the type of ML algorithm, you might need to split your data into different sets for training and testing the resulting model.
ML models can help explain and diagnose underlying trends in the data using techniques from “explainable AI.” Explainable AI comprises several methods that help explain the predictions of a model, rather than simply using its outputs — helping you to understand hidden causal relationships in the data.
Step 5: Interpret and report your findings
The last step of the data analytics process is to make sense of the patterns and irregularities found in the preceding steps. It’s also the stage where you can tie everything together into the story to tell to your stakeholders.
Depending on the expectations which were set at step 1, you now report one or more numbers to your colleagues, design a dashboard with several KPIs, or even write a detailed report that summarizes your findings and, possibly, their implications for the future of your organization.
Benefits of data analytics processes
The data analytics process can seem overly complex, especially to stakeholders who just want to get results quickly. But there are compelling reasons for working on data analytics process improvement and sticking to a streamlined, structured process:
- Proper integration: While you can take a slice of data from your warehouse and analyze it in isolation, such an “ad-hoc” analysis carries the risk of reaching the wrong conclusions. It can be misleading to look at certain datasets without context — for instance, when analyzing sales data without correlating it with marketing data.
- Scientific rigor: It’s important to combat your own bias — perhaps you (or someone else in your organization) are coming into the process with strong ideas about how or why something happened. Subconsciously, you might then try to confirm that bias in your analysis. A rigorous workflow reduces the risk of that happening.
- Reproducibility: When you follow predefined steps and document your workflow, it can be replicated — an important feature of a scientific project. The outcome of your analysis can then be readily compared to previous iterations of the same data analytics process, as they have all followed the same consistent procedure.
Tips for a successful data analytics process
Despite its potential for uncovering astonishing insights into the motivations behind users’ behaviors and the incentives that can motivate them to engage more with your product, not all data analytics projects are success stories.
Data-driven projects can quickly become irrelevant if they fail to answer a pertinent business question adequately and correctly. In addition to following a clearly defined data analytics process, here are a few more tips to help make your project a success:
- Document your steps. Proper documentation ensures that your project can be replicated in the future. It also helps with keeping track of outliers or “bad data” that you’ve removed.
- Work in teams or use peer reviews. This helps ensure that you stick to the data analytics process and let your personal biases (we all have them!) interfere as little as possible.
- Try to gain a holistic understanding of the problem, and the organization as a whole — especially if you’re coming in as an outsider. Being able to view a problem within a larger context is what distinguishes a good data analyst from a great one.
- Implement routine, standardized data quality checks for your data. Just as you test your code, you can test your data — to make sure that it isn’t outdated, faulty, or unreasonably skewed.
- Gather feedback on how your analysis was used in a decision-making process. Knowing how stakeholders perceive and implement your results will help you in your next project.
- Know when to stop. This may sound strange, but in theory, you could go on and on, tuning your ML model’s hyperparameters a bit more, doing another round of EDA… That’s why it’s good to be clear about your goals from the start, and stop once you’ve reached them.
- Use the right tools. Not every analytics project needs to use complex ML libraries — sometimes it’s enough to run a few SQL statements to get the information you’re looking for. Acquaint yourself with different tools for data storage and retrieval and creating visualizations, as well as libraries for data wrangling, machine learning, and statistics.
- Use visualization techniques that people understand. Some diagrams look cool but fail at conveying their message in an easily understandable manner — thereby defeating their purpose.
- Respect the customer’s privacy. By handling data in a privacy-aware manner, you protect your customers as well as your organization’s reputation.
- Try to keep a healthy balance between scientific rigor and creatively inspired decisions. Creativity and curiosity still play a big role in the data analytics process at every step: you need to select the right data, ask the right questions, and find ways to visualize your findings in a way that illuminates rather than obscures real trends and events.
Data analytics processes and customer data platforms
The basis for useful data analytics is high-quality, well-rounded datasets. You’ll want to build your statistical and ML models using the most comprehensive data about your clients’ interactions with your product — but unifying data from different sources can be difficult and time-consuming.
Customer data platforms (CDPs) do away with the need for compiling and unifying data manually. They combine customer data from disparate sources in a fully automated fashion, thus producing a more comprehensive picture of your users’ personal profiles and product journeys. Thanks to streamlined data integrations, CDPs send data to marketing, sales, and infrastructure tools in real-time, making for a faster decision process around customer data.
CDPs are therefore the basis for a more efficient data analytics procedure, freeing you up to spend more time on the quality of the data itself and on refining the models that help you make sense of your data.