What is descriptive analytics? Definition, benefits, and examples
Descriptive analytics means analyzing data to answer questions of the form “what happened?” or “what is happening?” Answering questions of the form “what happened?” is more specifically known as historical (or static) analytics, whereas answering questions of the form ‘‘what is happening?” is known as real-time analytics. You can use descriptive analytics either on its own to answer simple business questions like “Did overall sales go up or down last month?” or alongside other, more complex forms of data analytics to reach specific company goals.
This page explains what descriptive analytics is, describes how you can use it to inform strategic business decisions and organizational choices, provides examples of descriptive analytics in practice, and discusses its benefits and limitations.
Table of Contents
Descriptive analytics definition
Descriptive analytics vs diagnostic, predictive, and prescriptive analytics
How does descriptive analytics work?
Benefits of descriptive analytics
Challenges of descriptive analytics
What is descriptive analytics used for?
Examples of descriptive analytics
Financial metrics
Social media engagement
Web traffic reports
Trend identification
General business reports
Automated alerts
Are there descriptive analytics tools?
Descriptive analytics and customer data platforms
Using RudderStack for descriptive analytics
Descriptive analytics definition
Descriptive analytics involves interpreting historical or real-time data to better understand trends or relationships between online customer-driven events. An event is an action taken by your customer online where they interact with one of your products or services, and these events can be recorded for the purpose of analytics.
Descriptive analytics can help your company understand its market better or work out whether the business is on track to achieve its goals. It is the most basic form of data analytics in that it aims to answer simple, purely descriptive questions. Importantly, descriptive analytics does not aim to answer “why” something happened.
As such, descriptive analytics is often an organization’s entry point into the data analytics space. It is common to begin with descriptive analytics and then, with more experience, move on to more complex types of data analytics such as predictive analytics, customer data integration or the 360-degree customer view.
This type of analytics doesn’t attempt to predict the future (predictive analytics), give reasons why something happened (diagnostic analytics), or what action should be taken (prescriptive analytics). However, descriptive analytics is an essential part of data analytics, as a solid understanding of the past can provide useful insights. Its limitation is that it only answers basic questions; however, it can be paired with other types of data analytics methods to give a more rounded view of a business.
Descriptive analytics vs diagnostic, predictive, and prescriptive analytics
Descriptive analytics provides a foundation for understanding past events and outcomes in a business. Diagnostic, predictive, and prescriptive are three other forms of analytics that contribute to in-depth business assessments. Here’s how these analytics models compare to one another:
Diagnostic analytics: Understanding why things happen
While descriptive analytics details what’s happened, diagnostic analytics focuses on why they’ve happened. For instance, if descriptive analytics highlights a drop in sales, diagnostic analytics might indicate that a supply chain disruption or a competitor's promotion causes the drop. When a business understands the causes behind its metrics, it can address its underlying issues.
Predictive analytics: Projecting what’s likely to happen
Predictive analytics uses historical data to project future outcomes. It identifies patterns in data to forecast scenarios like changes in customer demand or shifts in market trends. For example, a retail business might use predictive analytics to anticipate which products will see increased sales during a holiday season, allowing it to optimize its inventory investments.
Prescriptive analytics: Identifying the next steps to take
Prescriptive analytics takes the insights from descriptive, diagnostic, and predictive analytics and uses them to recommend suitable actions. If predictive analytics indicates an upcoming spike in demand, for instance, prescriptive analytics might prompt an increase in production and the rollout of a targeted marketing campaign to take full advantage of the opportunity.
How different analytics approaches work together
These forms of analytics achieve maximum effectiveness when teams use them together. Descriptive analytics highlights what’s happening, diagnostic analytics explains why it’s happening, predictive analytics forecasts what could happen next, and prescriptive analytics recommends what actions to take. Together, they provide a complete picture that equips decision-makers with the best insights.
How does descriptive analytics work?
It’s important to follow a structured process when using descriptive analytics. The following sequence of steps will allow you to achieve the best results for your business:
Define your question
First, your company must decide on a question that can be answered using descriptive analytics. This means it must be about an event or trend that happened in the past or is currently happening. It is common for companies to use key performance indicators (KPIs) to guide their questions, as these are their most important company goals. The people who want to know the answers to the questions will be your project stakeholders. Once your stakeholders know what questions they want to ask, you must ensure that you have access to the data you need to answer them. If you don’t, you need to find a way to collect this data before you can begin your descriptive analytics work.
Aggregate your data
Next, aggregate all the data that may be relevant to answering your particular question together in one place. Using data purchased from third parties (alongside your own first-party data) can be helpful, as it can provide you with more information to answer your question. Aggregating your data into one place may involve an ETL (extract, transform, load) process: extracting data from various different locations, transforming it so that all the relevant data goes into a single table, view, or dataframe for ease of querying, and then loading it into a new location (usually inside a data warehouse).
Perform exploratory data analysis
Now that your data is aggregated together, you can do some exploratory data analysis. This involves investigating your data set to look for any useful information or anomalies, which may give insights that will help when cleaning your data later. For example, if you find that a disproportionately high percentage of people have input "Mr." for their title, you may need to investigate, as this is often the default value for a title field. You could compare their first names to a list of names that have a definite gender attached to them, enabling you to fix some of these values (you won’t be able to fix all the values, as some names are gender-neutral).
Choose your model
Exploratory data analysis can also help you decide on the most appropriate model for your main analysis work. This could be a SQL model or a statistical model such as linear regression or a clustering algorithm. However, for descriptive statistics, by far the most common model to use is a SQL model, as SQL lends itself very well to performing groupings and aggregates like sums, counts, averages, and percentiles. Combining that with SQL being far easier to learn than complex statistics or machine learning, you can see why descriptive analytics and SQL often go hand in hand.
Build your model
Once you’ve decided on your model type, it’s time to build it. If you’ve chosen a SQL model, this is best built by a data analyst. If it’s a statistical model, you’ll need to use your judgment of your and your team’s skill sets to decide if a data analyst or a data scientist is best placed to do this work. Either way, you will need an experienced and knowledgeable person to choose a suitable statistical model from the many that exist.
Share your insights
The final stage is to produce the requested outcome for your stakeholders in the form of a report or data visualization. It’s a great idea to make use of charts or other visualizations to form a data narrative – storytelling is a great way to ensure that your stakeholders are engaged and that they understand the importance of your analysis. Remember that some charts are more appropriate than others for certain types of data, and you should familiarize yourself with the best data visualization techniques for different types of data analytics questions.
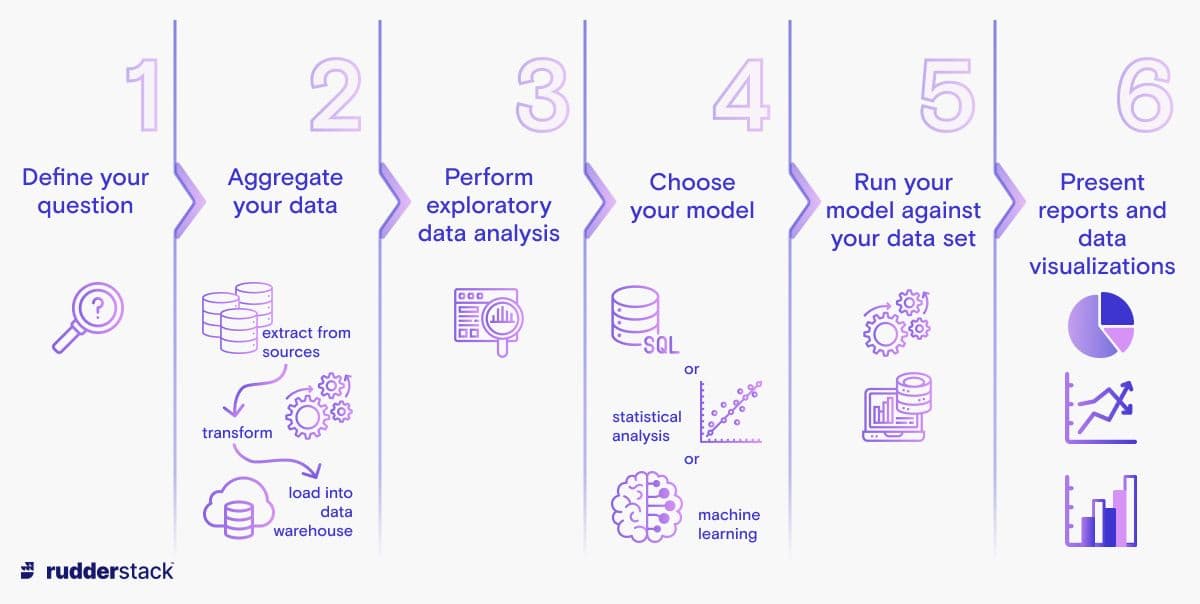
Image alt text: Descriptive analytics involves six main steps.
Decide your next steps
Depending on the scope of your research, and your organization’s budget, a descriptive analytics project can consist of answering a single question, where the project ends once the requested answer has been communicated to stakeholders. Alternatively, your descriptive analytics project can serve as a jumping-off point for more complex projects such as prescriptive analytics.
Benefits of descriptive analytics
Here are some of the specific benefits businesses can experience when using descriptive analytics:
Easier performance analysis and improvement
Using descriptive analytics allows workers to understand what’s been happening within their companies. This enables them to change strategies if they are failing to meet KPIs.
Descriptive analytics is also quicker to implement than other forms of analytics, so it reduces the time businesses need to spot trends and patterns, detect problems, and implement changes.
Smarter workflows with automated alerts
Businesses often use the information provided by descriptive analytics to adjust workflows, which can be done even more efficiently through automation. Setting up event-triggered automated alerts within descriptive analytics is a great way to keep track of worrisome developments (E.g., severe decreases in web traffic or conversions).
Greater information accessibility
Descriptive analytics typically uses simple reporting measures and analysis techniques, including line, bar, and pie charts. Wider business audiences can easily understand these, which makes descriptive analytics data very accessible.
Businesses can also use it together with other data analytics techniques (diagnostic, predictive, and prescriptive analytics) to create a comprehensive picture of business health for all departments.
Simpler cross-departmental collaboration
Descriptive analytics makes data more accessible to teams across an organization, helping departments align their efforts. A marketing team, for example, can use trends in social media engagement to refine campaign strategies, while a customer support team might use website traffic reports to anticipate seasonal spikes in inquiries.
Stronger strategic planning
By summarizing historical trends and patterns, descriptive analytics helps organizations refine their strategies. Businesses can use this information to assess the impact of past decisions and adjust their plans to better align with long-term objectives (such as improving efficiency or increasing customer satisfaction).
Challenges of descriptive analytics
As with most business techniques, there are both advantages and disadvantages to descriptive analytics. Identifying the most common challenges will allow you to overcome them and use descriptive analytics techniques effectively.
Inconsistent predictive power
Because descriptive analytics can only consider what’s already happened or is currently happening, it can’t fuel reliably accurate predictions. There are simply too many things that can change as time goes by and too many variables that analysts or tools cannot fully account for. Making predictions takes broader technical and industrial knowledge and relevant expertise.
Limited usefulness
While descriptive analytics highlights patterns and trends, it stops there, limiting its usefulness if businesses do not pair it with other forms of analytics. Any business that uses descriptive analytics methods needs a corresponding plan to carry out diagnostic and predictive analytics.
Inaccurate data quality
The accuracy of descriptive analytics depends heavily on the quality of the data that analysts are using. Incomplete, duplicate, or erroneous data can lead to misleading insights. Due to this, businesses must prioritize data cleansing and validation to achieve the main objective of descriptive analytics: reliable and relevant business insights.
Incorrect metrics
Descriptive analytics is only as useful as the metrics being analyzed. If analysts select the wrong metrics (or don’t align the right metrics with business goals), the resulting insights may lack relevance or bring confusion rather than clarity.
Strained systems
Even modest businesses gather vast volumes of data, making it challenging to figure out which areas to focus on and increasing the chances of information overload. To avoid straining your systems, it’s vital to start with clear goals and a strategy for choosing and interpreting data. This will also help your team prevent scope creep from causing issues in the future.
Biased data selection and framing
Stakeholders may choose to highlight metrics that confirm their assumptions or present performance in a way that makes it look better than it really is. All the while, the business as a whole can suffer. This calls for a firm commitment to choosing and analyzing data fairly, regardless of whom the results flatter or what the overall performance seems to be.
Unreliable human interpretation
Because descriptive analytics only organizes and presents data, it requires stakeholders to provide appropriate interpretations. If they fail to do so, the analytics project can lead to poor decisions, and potentially even a complete disconnect between the state of the business and how stakeholders or audiences perceive it.
What is descriptive analytics used for?
Descriptive analytics provides tangible benefits to your company by asking well-formulated questions that have a clear, achievable answer, such as “How many users did our website have last month?” or “What was the conversion rate for our most recent marketing campaign?” Some descriptive analytics examples are explained below.
Financial metrics
You can use descriptive analytics to produce financial reports on month-over-month sales growth or year-over-year product price changes. These reports allow you to monitor your company’s financial health over time.
Social media engagement
Your marketing team can use descriptive analytics to help them find out what content is most popular, and they can use this data to work out what kind of content they should share in the future. Descriptive analytics in marketing can start with generating reports on how social media likes, shares, and clicks change each month.
Web traffic reports
If your web team wants to improve your company’s website, a web traffic report is an example of descriptive analytics that can show the popularity of different pages on the site (by seeing how many users are clicking on each page). The team can then analyze their most popular web pages to work out what they are doing right.
Trend identification
Descriptive analytics can be used to identify trends in customer preferences and behavior regarding your product. You can use this to make a reasonable guess about future demand for particular features of your product. Netflix, for example, uses descriptive analytics to power the “trending now” part of its recommendation system. The popularity of this system is evidenced by the fact that 80% of all content streamed on Netflix comes via its recommendation system.
General business reports
Descriptive analytics in business can be used to generate internal reports on metrics like stock or cash flow to get a snapshot of how your company is operating or track performance over time (e.g., comparing successive years or specific sales quarters). Creating these reports can help you work out ways to improve efficiency, such as a new strategy for restocking products.
Automated alerts
Your company can use descriptive analytics reports as the basis of automated alerts; for example, when web traffic or key events decline by more than a specified amount, an automated email alert could be sent to the appropriate member of staff, enabling them to catch issues as early as possible.
Bottleneck pinpointing
Another descriptive analytics example is identifying operational inefficiencies or obstacles. A manufacturing business might wish to pinpoint minor obstacles that can have a compounding impact within its production lines. A customer service team, meanwhile, might want to determine when support requests spike, which would help with the appropriate allocation of staff.
Are there descriptive analytics tools?
It’s fairly easy to find tools for descriptive analytics. While there may not be many specifically designed descriptive analytics software options, the following types of tools are all good at streamlining the lengthy process of collecting, processing, and presenting data for the purpose of descriptive analytics:
Business intelligence tools
Business intelligence (BI) tools such as Power BI, Looker Studio, or Tableau are highly useful for descriptive analytics. Offering convenient, user-friendly dashboards and solid reporting options, they help teams share data clearly and communicate more effectively.
Statistical tools and libraries
Tools such as SPSS (Statistical Package for the Social Sciences), the SAS (Statistical Analysis System) suite and the free open-source alternative Jamovi offer more advanced statistical analysis that can help here. Because they include various relevant features (from generating basic summaries to producing multivariate statistical models), they empower businesses to uncover deeper data insights.
Spreadsheet tools
Industry-standard spreadsheet tools, such as Google Sheets and Microsoft Excel, can carry out numerous operations that can aid in descriptive analytics. They can calculate averages, frequencies, and ranges, and turn them into basic visualizations that will suffice in many situations.
Database management tools
When dealing with huge datasets, retrieving relevant entries, aggregating them usefully, and creating summary reports is easier with effective database management tools. SQL is the most popular system for handling structured datasets, so tools based on it (such as MySQL and PostgreSQL) are solid choices here, but there are tools using other query languages (such as Cypher or N1QL) that offer further flexibility by catering to different data structures.
Data preparation tools
Data teams should properly prepare data used for descriptive analytics to highlight file-type issues and reduce formatting errors. Tools like Alteryx, Talend, and Datameer can smooth out the process of cleaning, reformatting and integrating data drawn from different sources.
Descriptive analytics and customer data platforms
Descriptive analytics deals with historical data and involves detecting patterns and trends to better understand your business. When used alongside diagnostic, predictive, and prescriptive analytics, the information from descriptive analytics allows you to make even more informed decisions on your marketing strategies and other business functions.
Customer data platforms can help save time collecting this historical event data in the first place, or at the ETL stage during descriptive analytics projects. Instead of data analysts having to extract data from various sources, transform the data, and load it into a data warehouse, a customer data platform can automate much of this process. It allows you to set up a data pipeline between your different data sources and your data warehouse, continuously transforming your data into a useful format as it is loaded into the data warehouse. This allows data analysts to focus on the other steps in the descriptive analytics process.
Using RudderStack for descriptive analytics
Descriptive analytics needs accurate and well-organized data to produce meaningful performance insights, so if you’re going to use descriptive analytics to achieve meaning and business insights, you need to get your data in order. Luckily, you can do just that with RudderStack.
Drawing upon over 200 integrations, you can connect all your data sources and seamlessly route business and customer data into your data warehouse, taking all the strain and effort out of the process.
The sooner you stop wrestling with data preparation and cleansing, the sooner you can start using reliable descriptive analytics to uncover key takeaways and identify significant opportunities for improvement.
Start your RudderStack free trial today and discover what it can do for your business.