The Difference Between Data Analytics and Statistics
Data-driven businesses take the data they collect through their business lifecycle and convert it into valuable, actionable insights that improve productivity and profitability. Many data projects will seek to increase the value of data by maximizing the quantity of data collected. Others will focus on curating and repackaging existing data to ensure that it’s high quality and fit for purpose. In any case, the better the initial data commodity is understood, the more effectively wealth can be extracted from it.
In order to understand data efficiently, you need an organized method for the experimentation and analysis of a dataset. The scientific field of Statistics and the field of data analytics have evolved to accomplish this, first as solutions to mathematical problems, and recently as specific applications to improve data analytics processes.
This article will explain the difference between data analytics and Statistics. It will also explain how you can use data analytics and Statistics together to get maximum value from your data.
What is data analytics?
Data analytics is a term for the processes and methods that an organization uses to extract value from data. Data analytics has a wide scope and is therefore broken up into a number of sub-domains, such as data engineering, data analysis, or data modeling. When talking about the whole stack of data analytics, people often discuss the data analytics lifecycle, a framework for thinking about the whole pipeline of data analytics.
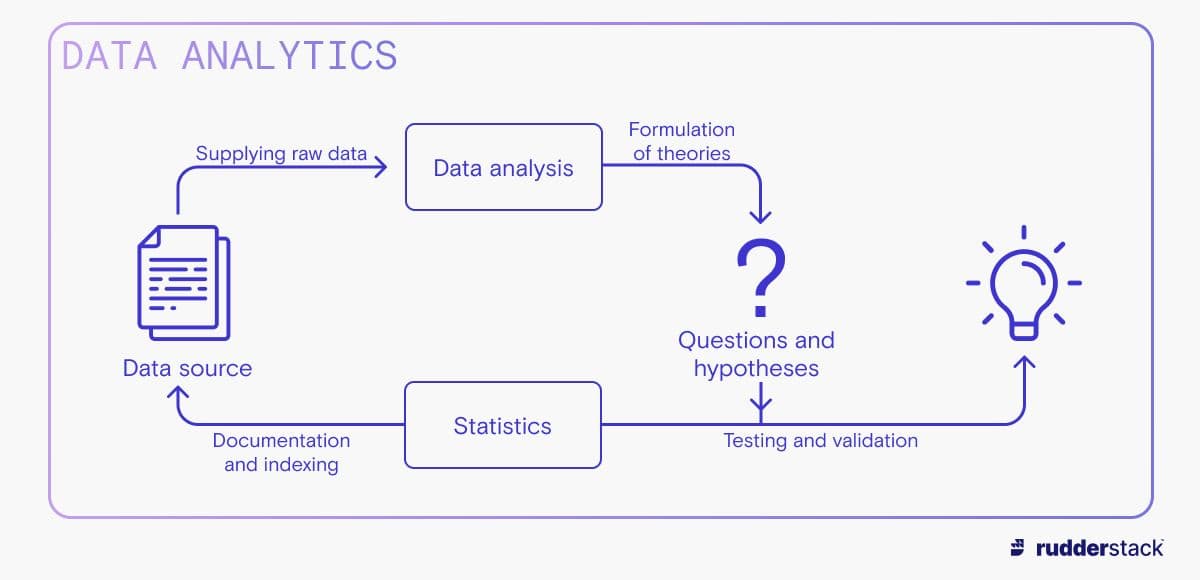
Patterns in data are generally identified by data analysts who are ingrained in the data analytics lifecycle. The data analyst is usually involved in generating hypotheses rather than mathematically testing and accepting or rejecting them. This role is vital because data is often difficult to conceptualize or intuitively consider. However, it also demands a more rigorous validation later in the data analytics flow.
Data analysis generally falls into one of several categories:
- Descriptive: identifying patterns of large-scale trends in existing data and communicating them using visualizations
- Diagnostic: drawing correlations from different patterns in the data, possibly with some causal testing
- Predictive: extrapolating likely outcomes based on historical data
- Prescriptive: estimating the effect of various possible decisions on a given metric
These directions of analysis are largely concerned with characterizing data (either historical or estimated future data). Therefore those directing data analytics should have a strong understanding of the existing data and an ability to quickly extract and navigate datasets from the data infrastructure. Anyone working with your data should be able to communicate the meaning behind data, framing it for those who need to take action based on it.
What is Statistics?
While statistical analyses can be and often are performed independently, they can also be part of a company’s data analytics pipeline. This can lead to some confusion in distinguishing the two concepts. Here we will compare the data analysis component of data analytics with Statistics. However, it’s worth noting that the field of Statistics encompasses far more than what we would refer to as the Statistics performed under the umbrella of data analytics.
In this context, statistical methods are used to pick up the patterns and correlations generated by data analysis and attempt to confirm them using rigorous scientific methodologies. We tire of being reminded that “correlation doesn’t equal causation,” but simple pattern matching is an easy trap to fall into, especially when an identified trend is important to stakeholders. Statistics is employed as a vital quality control of the analysis output in data analytics to counter this tendency.
There is another important role fulfilled by a statistician, even before theories exist to be (dis)confirmed. Data might be pre-processed and indexed by data engineers, but data stores are often still too vast or complex to be navigable to investigators. Statisticians can therefore assist with qualifying or summarizing existing data such as: Which outliers should be discarded and which accounted for? Under which circumstances is the mean a better measure than the median?
This component of Statistics is often concerned with the documentation and description of datasets. It requires an understanding of the context of a dataset, its business or process implications, and the mathematical basis of various measurements of that data. Statisticians, therefore, require a grasp of the shape of the data they work with, the business context, and a strong mathematical background.
Data Analytics
How is data analytics different from Statistics?
As discussed above, this can be a tricky taxonomy to map. Statistics is either part of a larger data analytics process, or it’s used outside of what we would refer to as data analytics. To characterize Statistics and data analytics as opposed processes is a bit misleading – analytics needs Statistics and Statistics needs many of the processes in analytics. However, data analysis is distinct from Statistics in the context of the data analytics lifecycle.
Broadly, while data analytics observes trends and patterns in data, Statistics validates those theories using scientific processes. Analytics is concerned with exploring and presenting data for decision-makers — this requires an ability to respond quickly to communicate sudden changes or meet the needs of executives who are themselves responding to acute situations.
Once these observational trends are developed by data analytics, it is necessary to validate them — separating the wheat from the chaff. While data analytics explores events and explanations, Statistics compares them, giving weight to some explanations and casting doubt on others.
Both processes are vital to the success of a business, but the roles are organized quite differently. The toolset used by data analysts is more focused. Skill in a query language and a grasp of business applications are crucial to the data analyst. They are generally attached to a specific team, and there are many of them (leaders at every level and in every department need to be able to parse data effectively).
On the other hand, statisticians require a high level of mathematical knowledge and experience, making them harder to find (therefore fewer in number and better compensated). Statisticians are likely not to be deployed across the company, but rather to be centralized in the core data team, and to take on only projects that have significant consequences for the company. People with a strong background in Statistics are often hired as data scientists, rather than picked up in a statistician role.
How data analytics and Statistics change with scale
The responsibility of these roles can change significantly with the size of an organization or the volume of data it handles.
At smaller organizations, it is often preferred to hire a few highly skilled data scientists/statisticians who are well-rounded enough to fill out the communications aspects of a data analyst role (or the reverse — the mathematical basis of Statistics is not impossible to learn or apply, so most data analysts can grow into the role of statistician).
At larger organizations, communication between teams becomes more difficult and information decays faster. Data analysts become a prerequisite for teams to be able to operate autonomously. This high demand for data analysts means that large organizations also require dedicated statisticians who are insulated from mission creep and are able to adequately fulfill the company’s statistical needs.
The size and number of datasets can also influence the deployment of these roles. At smaller data volumes, it can be difficult to draw out well-founded statistical conclusions – therefore it can be wasteful, at low data volumes, to spend too much time on mathematical rigor in the data analysis.
Similarly, as data scales up in volume and diversity, it becomes more difficult to track and document all the information that might be relevant to a particular decision. This, in turn, favors employees specialized in acquiring and supplying relevant data. In such cases, the statistician is a good augmentation to the data analytics pipeline, as the role is well suited to inventorying and indexing datasets.
Diving deeper into data analytics
In almost all cases, a company requires some combination of the data analytics and Statistics roles — it is rarely a case of choosing one or the other. While data analysts explore and communicate data, statisticians provide important checks and validation of the analyst’s work product.
Further reading
To help fill the data analytics and Statistics roles, managers and prospective data workers can refresh their knowledge of data system architectures. That’s why Rudderstack is proud to keep our learning center stocked with relevant information on topics like: