How to Create and Use Business Intelligence with a Data Warehouse
Business Intelligence (BI) comprises data gathering and storing, knowledge management, and analysis to provide input to the decision-making process of any business. BI’s purpose is to hold comprehensive knowledge about the factors that impact an organization—its customers, its competitors, its partners, its internal operations, and the macroeconomic environment—and make it available to business stakeholders.
Data typically moves through several layers of the BI stack before being consumed for decision-making. First, data gets captured in a batch or via a stream. This is often called “bronze quality data”. Second, this raw data gets stored in a data repository optimized for analytical loads, usually a data lake or an enterprise data warehouse. This is often called “silver quality data”. Third, data gets remodeled into one or more tables at which point it is often called “gold quality data” since it is now ready for general consumption. Fourth, a visualization or reporting tool consumes these ready-made tables.
In this article, you will learn about the potential of business intelligence and the tools you can use to set up a modern BI stack.
Who Needs Business Intelligence
Most, if not all, businesses require data and information to support their decision-making. For example, answering the basic question, “how much commission should I pay my salesperson?” requires sales data, territory mapping, quota information, etc. That’s where BI comes in. By capturing the correct data and using adequate technologies, any organization can set up a Business Intelligence stack and embed analytics products into every aspect of their business’s decision-making process. Here are three popular examples of how organizations do so.
Sales trackers are an organization’s most popular internal report. Managers use them to evaluate the sales team’s efforts and, potentially, to calculate individual or team commissions. Usually, their reports are based on data that gets extracted from operational systems, such as an enterprise resource planning (ERP) tool or an online transaction processing (OLTP) database. First, most organizations own this data and have it on premises. Second, extracting data from them is relatively easy. On top of their business value, these two considerations ensure that sales trackers are high on the priority list.
Marketing reports and dashboards have also gained prominence in the past couple of decades. Before, marketing efforts were often quantified with hypothetical figures about reach. With the advent of the digital age, marketing budgets shifted toward digital channels. These channels have a data trail as a byproduct, which organizations can tap into for BI purposes. Typical marketing reports are built around return on marketing investment (ROMI) to evaluate individual campaigns, channels, and audiences. More advanced techniques use machine learning–driven attribution models to assign each conversion to one or multiple channels.
Typically, software companies have product dashboards that visualize how users engage with their products. They answer questions about the recent feature launches; the most popular features; the number of daily, weekly, or monthly active users; and so forth. Modern tracking tools allow software companies to track every click or tap to gain insights into how their users engage with their products. It is an essential prerequisite for delivering continuous improvement and data-driven decision making.
What You Need for Business Intelligence
In most situations, the consumers of business intelligence are internal stakeholders. They consume the data and information generated via standardized reports, dashboards, or ad hoc analyses. This section outlines the tools and roles that work in tandem to produce these analytics products.
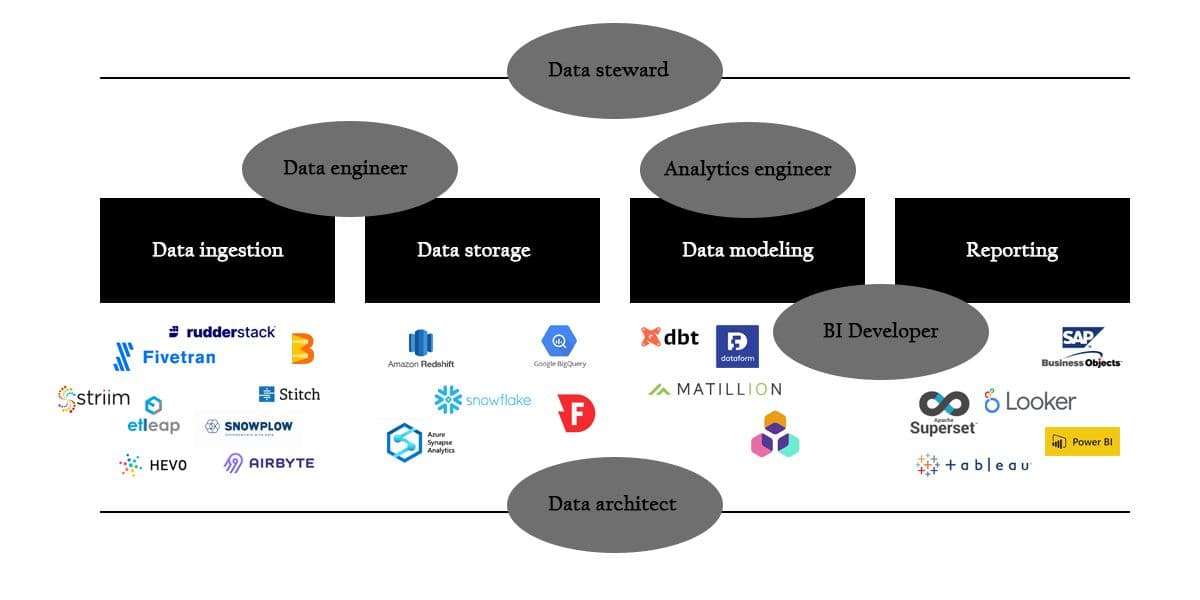
Business Intelligence Image
Roles and Responsibilities
There are various approaches to organizing analytics capabilities in an organization. Typically, companies with limited analytics maturity have a decentralized model, where each department is responsible for its own business intelligence, or none at all. On the other hand, companies with a proven history of analytics initiatives tend to adopt a more centralized modus operandi or have a center-of-excellence approach with a dedicated team that focuses on business intelligence for the entire organization.
A hybrid approach is to have a centralized team responsible for data operations that works closely with embedded subject matter experts in the rest of the organization (e.g. Customer Support Analyst, Product Analyst, Sales Analyst, etc.)
Nevertheless, the workflow for turning data into an analytics product isn’t necessarily contingent on the operational model. That’s because, at its core, every operating model requires the same kinds of roles and technologies.
Good BI teams don’t try to do everything by themselves. On the contrary, they deliver the insights that the business teams have prioritized. Often, BI teams have business analysts or product managers to interpret and translate business requirements. However, a BI-focused product role probably won’t be available in organizations with a decentralized operating model. In that situation, business people work closely with the analysts in their team.
What happens next is highly dependent on the availability of the needed data to produce the required insight. Analysts or BI developers can quickly build the requested interface if all data exists and is exposed.
But what if the data isn’t available? In that case, many people act as cogs in a well-oiled BI machine to get from data to insight, with a mix of several possible roles involved.
- Data stewards are the go-to person for questions about whether and how data is collected, what its quality is, and what its interpretation is. If the necessary data isn’t ready for use, they’ll point you in the right direction.
- Data architects are responsible for the data infrastructure. They decide on technologies for capturing, storing, transferring, and analyzing data. Supporting business intelligence needs is often a massive part of that responsibility.
- Data engineers set up and maintain data pipelines from source systems to a data sink, such as a data lake or a data warehouse. Data orchestration and data integration software are the most critical tools in their Swiss Army knife.
- Analytics engineers are employed by most organizations with a modern data stack. They work in the enterprise data warehouse to model and wrangle the data to make it consumption-ready.
- BI developers develop, deploy, and maintain the interfaces that end users consult. A BI interface comes in many formats: a dashboard, a recurring report, an ad hoc analysis, a query system, and so forth.
Depending on the size of the organization, individual people may span a number of the above roles. Either way, with so many people and processes involved, it’s clear that the end-user interface is only the tip of the iceberg. There often is a well-orchestrated undertaking behind every enterprise report or dashboard.
Software and (Cloud) Infrastructure
Most analytics products require the interplay of a variety of tools. This section outlines the necessary tools for setting up a modern BI architecture. Such an architecture must take the following into consideration:
- Organizations need to extract data from databases and software as a service (SaaS) tools. Furthermore, some of that data is available in a batch, while other sources provide a data stream.
- Modern data warehouses have their computing power and storage capabilities decoupled. For this reason, they can act as both a data sink (for storing raw data) and a reporting layer (for serving cleaned data sets).
- Organizations still need a proper tool to make the required transformations although data warehouses store both raw and cleaned data.
Data Ingestion
Data ingestion tools are very contingent on the source system. There are many ways to categorize these systems, but the following categorization should cover most use cases:
- Batch loading OLTP database snapshots: Ingesting data from OLTP databases doesn’t necessarily require specialized software. Database software (like PostgreSQL) can dump complete databases or export tables to CSV on a recurrent basis. A simple script often suffices to load the files into a data warehouse.
- Batch loading from SaaS systems: These days, most SaaS tools no longer are walled gardens. On the contrary, accessing their data is usually just one call to a REST API away. However, these APIs can be complex, and they continuously evolve to support new features or changes to the software’s data model. This fact has given birth to a range of tools that guarantees integration with hundreds of SaaS tools. With these tools, loading data from SaaS platforms (such as Salesforce, HubSpot, Google Analytics, and Mailchimp) is only a couple of clicks away. Some of the most popular vendors are Fivetran, Etleap, Stitch, and Airbyte.
- Loading streaming data: Many organizations are shifting to an event-based system. Instead of creating point-to-point integrations between their tool stack, tools can publish and subscribe to events in an event stream. Modern data warehouses can receive events and store their values to capture this data in motion. Tools for integrating subscription-based streams, such as Apache Kafka or Google Cloud Pub/Sub, into your data warehouse include Hevo, Striim, and Apache Beam. Event-based systems, like Snowplow or RudderStack, come with plug-and-play data warehouse connections.
- Change data capture: Registering the changes in a transactional database is another way of capturing data in motion. This method is also called change data capture (CDC). Initially, this approach aimed to improve access speed and data availability for OLTP databases in a globalized context: for example, Australians should get the same experience as Americans. Now, this mechanism can also be used for replicating data to online analytical processing (OLAP) databases, such as data warehouses. Noteworthy integration tools that support CDC are Striim, HVR, and Airbyte.
Data Storage
Before the rise of cloud computing, most organizations built BI stacks around OLAP cubes. Raw data was kept in their source systems or as blobs in storage, such as data lakes, even before that became a term. Specialized teams maintained ETL (extract-transform-load) pipelines to transform and aggregate the data into a memory-efficient form so that the end user could slice and dice it as they pleased.
Although we refer to these memory-efficient analysis tools as OLAP cubes, they support more than three dimensions. However, as they were maintained on premises and limited by their hardware constraints, ETL teams constantly had to balance business value against memory limitations, query speeds, and associated hardware & software costs.
However, the world has come a long way from SQL Server, SSIS, SSRS, and SSAS. Due to the decoupling of storage and computing power, modern data warehouses, such as Google BigQueryand Snowflake, lend themselves to an ELT (extract-load-transform) approach. Data warehouses have become both a data sink and a reporting layer. Only a modeling tool (infra) separates these two phases. The following are some of the most popular data warehouse solutions and their distinguishing features:
- Amazon Redshift, with Amazon Web Services (AWS) having the first-mover advantage, was one of the earliest modern data warehouses to break into the business community. Redshift isn’t necessarily serverless and has many configuration settings for scaling clusters and optimizing schemas. Also, long-term commitments are rewarded with deep discounts.
- Google BigQuery is an entirely serverless data warehouse; ergo, it scales with every query. It supports storing semistructured data through repeated and nested rows. BigQuery can act as a sink for real-time data because it supports streaming inserts. Finally, you can use its query engine to query external data sources, such as Google Cloud Storage, Bigtable, Drive, Spanner, and Cloud SQL. It also comes with a machine learning engine.
- Azure Synapse is Microsoft’s latest bundling of data and analytics services. Dedicated SQL pools are the core data warehouse capabilities. However, Synapse aims to provide an end-to-end analytics experience. That’s why it comes with a data integration tool, a Sparkengine (for machine learning), and codeless data wrangling.
- Snowflake, without a doubt, was responsible for 2020’s hottest tech IPO. It’s deployable on all major cloud vendors (AWS, GCP, and Azure). It’s entirely serverless and requires no maintenance. Snowflake has a very flexible pricing model in which storage and computing are calculated separately. Via Snowpipe, Snowflake supports continuous loading of both batch and streaming data.
- Firebolt is a newcomer to the data warehouse universe. It’s a self-proclaimed third-generation data warehouse, boasting massive speed improvements over their competition. Currently, it’s only deployable on AWS. Although it’s completely serverless, it offers a fair degree of configurability.
Data Modeling and Transformation
Landing data is one thing. Serving it for BI and machine learning purposes is another. Many organizations rely on classic data warehouse tools to produce their trusted data sets: materializedviews) and scheduled queries. However, there are alternatives. These tools abide by best practices from software engineering, such as version control and CI/CD. Their stellar rise gave birth to the subdiscipline of analytics engineering: the practice of transforming, testing, deploying, and documenting data.
- data build tool (dbt) became the only pure analytics engineering tool after Google acquired Dataform in 2020. dbt took all the best from software engineering and adapted it to the world of analytics: automatic inference of dependencies, macros, dynamic variables, and auto-complete. They have a massive community that provides help and community maintained connectors such as AWS Athena and even SQLite
- Matillion isn’t a pure data engineering tool: it comes with a long list of connectors for ingesting data on the one hand and syncing it back to SaaS platforms on the other hand. Just like dbt, it runs on all major cloud data warehouses. This all-in-one solution has made it another community favorite.
- Y42 is a relatively new player from Berlin. Once again, it’s more than a tool for analytics engineers. Like Matillion, it comes with many connectors for ingesting and syncing data. It even has some basic visualization features. Y42 has a very intuitive graphical, no-code, and no-SQL interface for the less technically inclined.
Reporting and Dashboards
The final layer in the BI stack is reports and dashboards. Because these tools are omnipresent in the decision-making process, many equate them to business intelligence.
- SAP BusinessObjects (BO) can’t get any more corporate when it comes to reporting. BO’s strength lies in its semantic layer known as a Universe. It describes joins between tables, object and filter definitions, possible values, hierarchies, and so forth. It has data governance and security embedded in every aspect. It’s good at producing static, printable reports. Nevertheless, it isn’t great for interactive analysis (e.g., via dashboards).
- Looker, acquired by Google in 2019, is a 100 percent browser-based tool. Just like BO’s Universes, it has modeling capabilities, known as LookML. Looker doesn’t extract any data; it uses the data warehouse’s native query engine to run queries and calculations.
- Tableau has a strong focus on data visualization and exploration. Nevertheless, since its acquisition by Salesforce in 2019, Tableau has worked heavily on its data preparation capabilities, known under the umbrella name of Prep Builder. Contrary to Looker, it does take data into memory, allowing users to load and query data that doesn’t reside in a data warehouse.
- Power BI integrates magnificently into the Microsoft ecosystem. On the one hand, you have a single experience that extends well into the Office suite. On the other hand, Power BI plays best with data stores from Microsoft Azure. And if that isn’t enough, Power BI is part of Microsoft’s Power Platform, which is a set of business tools for embedding analytics, apps, and automation in large organizations.
- Superset is an open-source data exploration and visualization platform that, like Looker, leverages the power of existing data infrastructures. It has a fully managed solution known as Preset.
- Mode Analytics is a robust cloud BI and data visualization tool that also offers built-in support for data science applications with Jupyter notebooks.
Conclusion
In this article, we addressed why your organization should utilize business intelligence and set up a BI stack. We covered the different roles that are responsible for working with and maintaining this stack:
- Data architects
- Data stewards
- Data engineers
- Analytics engineers
- BI developers
Then we outlined the four BI layers, each building on top of the previous, that these roles focus on:
- Data ingestion
- Data storage
- Data modeling and transformation
- Reporting and dashboards
Note: While it might be tempting to try and start building dashboards on top of a transactional database, it is highly recommended to tackle each step in order to fully leverage a modern BI solution.
Finally, we looked at over twenty tools across these four layers that you might consider as you set up your BI stack.