Blog
What is the Growth Stack?
What is the Growth Stack?

Eric Dodds
Head of Product
30 min read
June 14, 2022
This is part II of a series breaking down each phase of the Data Maturity Journey, a framework we created to help data teams architect a practical customer data stack for every phase of their company’s journey to data maturity.
A unified data layer that sends consistent events and user profiles to your entire stack is a wonderful thing. We call that architecture the Starter Stack. It’s a critical first step towards data maturity. When you implement the starter stack, good things happen:
- Your analytics start working properly
- Marketing gets better attribution visibility
- Sales gets stronger lead intelligence
- Product can test and optimize new user flows with velocity
- No more spreadsheet fire drills when leadership requests a basic report
In short, a unified data layer gives you accurate visibility into who your customers are and how they interact with you. This enables leaders and teams to fundamentally understand what’s working and what’s not, so they can adjust their work accordingly.
But as people learn more about the customer and the business, they start asking more complicated questions. Once your marketing team has a handle on first-touch attribution, they start thinking about multi-touch attribution. Once your product team has a handle on the basic user journey, they start wondering about subsets of customers and how they might use your site and app differently. And, of course, the executive team builds an appetite for advanced reporting, craving more detail on financial metrics like revenue, margin, and lifetime value.
Those questions relate to driving growth through advanced optimization, not simply understanding the current state with accurate data. That makes total sense: once you understand what’s working, Marketing wants to spend more money efficiently, Product wants to drive more impactful optimizations, and leadership wants to grow the bottom line. But advanced optimization requires additional data—data that the Starter Stack can’t provide.
When you reach this inflection point as a company, you’ve outgrown the Starter Stack. It’s time to augment your architecture with bi-directional data flows and a centralized data storage/compute layer to unlock the next phase of optimization. In the Data Maturity Framework, we call that architecture the Growth Stack.
What is the Growth Stack?
To understand the Growth Stack, we need to remember what the Starter Stack solves for. The Starter Stack eliminates duplicitous data flows with a single, unified data layer. This layer handles capture and integration for the event and user profile data generated by your websites and apps. Once implemented, it drives consistency across all of the SaaS tools used by downstream teams without painful integration work.
Even if the data across your SaaS tools is consistent, though, each system is still only capable of achieving a local maxima in optimization because each SaaS tool is a terminal destination for data in a linear data flow. This means that even though the data matches across systems, they are all data silos.
You could make the argument that silos don’t matter if you have consistent data from the source, but that’s not the problem. The problem is that each of those SaaS tools themselves create new kinds of customer data.
For example, your email marketing tool creates lots of net-new customer data. Data points like email opens and clicks are events that play a big role in the customer journey—but that data stays trapped in the email marketing tool. Similarly, your sales team creates valuable data in your CRM related to deal cycles, opportunity stages, risk statuses, etc. and that data stays trapped in the CRM.
These data silos make it impossible to both answer more complex questions and to actually use every customer data point, both of which are key to unlocking further optimization.
So, what is the Growth Stack?
The Growth Stack introduces bi-directional data flows and a centralized data storage/compute layer to address two fundamental problems caused by data silos:
- Incomplete data: when data created by downstream tools is trapped in those tools, it’s impossible to have a full picture of the customer journey or a customer profile that uses every customer data point
- Complexity of activating centralized data: if you do centralize data, you get the full picture in one place for analysis, but advanced optimization requires the ability to access every customer data point to use in downstream tools
The Growth Stack solves these problems by:
- Introducing a centralized data storage/compute layer to serve as a comprehensive source of truth for every customer data point across the stack
- Unifying every customer data point in this central storage/compute layer by:
- Turning data destinations into data sources, creating bi-directional data flows
- Pulling data from separate systems (like financial systems) into the central storage/compute layer
- Making the central data store accessible to every tool in the stack (this is the activation of centralized data)
As you can see, the Growth Stack involves the addition of multiple new pipelines and data flows, so it’s a big step forward in terms of the sophistication of your stack. In the implementation guide below we break down each component and the data flows in detail, here’s what Growth Stack architecture looks like at a high level:

When do you need to implement the Growth Stack?
Before we get into the details of the architecture, data flows, and implementation process, let’s step back and talk about when you need to implement the Growth Stack.
Symptoms that indicate you need the Growth Stack
If you have consistent data across your tools, but teams feel like they’ve hit a ceiling in their ability to understand and optimize the customer journey (and business), you’re ready to start planning a Growth Stack implementation. Here are a few specific symptoms you might have:
- Teams want data from other tools that are hard to get. For example:
- Marketing is mapping the customer journey and wants to look at email activity alongside web activity to understand the most effective paths to purchase
- Sales wants notifications of key activities on the website or in the product, so they have the full context before messaging prospects
- The reporting requested by both downstream teams and leadership requires data from systems that aren’t connected to the customer data stack. For example, leadership might want to understand margin in the context of coupons, but that data lives in a payments system or ERP.
- Teams want to build and analyze customer segments that aren’t possible to create in SaaS analytics tools because of different data models or an inability to combine different types of data (i.e., event data and relational data).
What your company and team might look like
Both smaller companies as well as large enterprises struggle with centralizing and activating customer data and need to modernize their stack with a unified data storage / compute layer. When to implement the Growth Stack is less about company size and more about data needs.
That said, companies who run the full version of this stack tend to be in the mid-market, mostly because running this infrastructure means you have a lot of data and dedicated data resources. Here are a few indicators that you’re ready for the Growth Stack.
If your company is on the smaller end of the spectrum, you:
- Have brought on your first dedicated data resources, but centralizing data is still a major challenge
- Find downstream teams reverting back to point-to-point integrations to get the data they need (despite your efforts to centralize data integration), re-introducing the data consistency problem
- Have explored expensive, enterprise analytics tools as a solution to your visibility and consistency challenges
If your company is on the larger end, you:
- Have an established data team or teams
- Have legacy data stack components and data flows that require tribal knowledge to manage
- Are dealing with increasing complexity related to multiple legacy batch jobs that move data between systems
- Have tried to build a full picture of the customer with enterprise marketing software, to no avail
Returning to our practical example company
Let’s return to our real life example from the Starter Stack guide. Here’s a description of the company:
You’re an eCommerce company, large or small (as we said above, company size doesn’t matter). Your website, mobile, and marketing teams focus on driving digital purchases through your site and app, but you also have a sales team supporting wholesale buyers. Many of the sales team’s prospects are long-time repeat digital purchasers who would benefit from opening an account.
By implementing the Starter Stack, you have moved from multiple replicated data flows and inconsistent data to a unified data layer for events and customer profile updates, as shown in the diagrams below.
Before Starter Stack implementation:

After Starter Stack implementation:

The data stack
Your Starter Stack streamlined event and user profile updates, so the architecture is really clean: SDKs in your website and mobile app send single user events with a standardized schema through an integrations layer and update these downstream tools with the same data:
- Web analytics
- Product analytics
- Email marketing and automation
- CRM
- Ad platforms
Since implementing the Starter Stack, though, several new tools have entered the picture:
- Customer support software – the support team introduced a platform to streamline support for digital purchasers and wholesale customers. Luckily this integrates with your existing data layer for events and customer profile updates.
- Payments infrastructure – Increased appetite for advanced financial metrics required a payments infrastructure that wasn’t fragmented across web and mobile. You implemented a more robust platform, but it creates relational data, not event data, so it doesn’t integrate with your existing data layer.
It’s important to note a particular characteristic of the data in the two new tools that highlights a key difference between the Starter Stack and the Growth Stack. The data in the customer support and payments systems is relational data, not event payloads, which directly influences the pipelines we need to manage it. More on that below.
Here’s what the stack looks like with the addition of these new tools:

Your data challenges
- Your go-to-market teams have hit the limits of their SaaS tools for web and product analytics. There are two flavors of this problem:
- Their ability to analyze user behavior across platforms is limited because of the different data formats of their respective analytics tools. For example:
- Your marketing team wants to understand the relationship between email and web behavior, but they’re limited to tagging links in emails and using the UTM parameters on pageviews in their web analytics tool. This is messy and doesn’t scale.
- Analysts want to track the full user journey for wholesale customers, but part of the wholesale journey lives offline. Specifically, sales calls are offline events that are recorded in the CRM. These can’t be tracked via event streaming.
- They want to break analytics down by user segments, but the data needed for segmentation is inaccessible because it lives in other tools. For example:
- The mobile team wants to better understand how wholesale customers use the mobile app in order to optimize new features for them. The customer type flag, though, lives in Salesforce and is set manually by the sales team, so it’s not available in the product analytics tool. (And, of course, dev doesn’t want to touch the “Salesforce custom field to product analytics integration” ticket…yikes.)
- Their ability to analyze user behavior across platforms is limited because of the different data formats of their respective analytics tools. For example:
- Marketing wants to move from first-touch to multi-touch attribution. They need detailed ad performance data from their ad platforms, but they have no way to join it with user behavior data in their web analytics tool.
- Your executive team wants more advanced financial reporting. It’s impossible to produce what they’re looking for in any of your analytics tools, so you’ve resorted back to laborious and error-prone exports and spreadsheets. For example:
- The executive team wants to see if different demographic segments use coupons at a higher rate (and thus have lower margins). This is hard to answer because demographic data lives in the CRM and discount data lives in the payments platform.
- Your data team (and likely ops team) is spending time managing integrations again because the demands of downstream teams require ad-hoc and inconsistent liberation of data from silos.
The Growth Stack Playbook: implementing a warehouse-first customer data platform
Goals of the Growth Stack
Data stack modification (or modernization) is almost always a response to increased complexity. That complexity can come from a demand for new use cases that require new functionality or as growing technical debt that needs to be addressed.
The Growth Stack is a response to increased complexity that the Starter Stack can’t handle. Specifically, when use cases arise that require usage of all customer data, including new data types, you have to implement new tooling and new data flows.
The goals of the Growth Stack stage are:
- Eliminate data silos to collect and centralize all customer data from the stack, giving you a complete view the customer and their journey
- Make that data available for use by every tool in the stack
If you build a full picture of your customer, your downstream teams will break through the barriers of localized optimization. They’ll be able to act on insights and the data driving them.
Data focuses of the Growth Stack
The data focuses of the Starter Stack phase were behavioral data (events) and user traits. But as SaaS tools and external systems create additional customer data, the Starter Stack can’t tell the whole story, and you’re creating data that teams can’t use. The data focuses of the Growth Stack directly address this limitation.
Growth Stack data focuses:
- Relational customer data from other systems (SaaS, transactional, etc.)
- Computed user traits
Relational data from other systems is simple: CRM data, payments data, etc. This is sometimes called “tabular data” (because it is often in column/row format) or even “structured data” (i.e. a structured data set, as opposed to a single event).
But what do we mean by computed traits?
If pulling in relational data from other systems is how the Growth Stack accomplishes centralization, computed user traits are the primary way it makes that data available to every other system in the stack. We use the term computed because syndicating data from a centralized store back to downstream tools requires some sort of computation to make the data usable in downstream tools.
Let’s say you want to syndicate data points trapped in one system, like your CRM, to another tool, like your product analytics platform. Lead qualification flags are a good example. Your product needs to analyze feature usage by qualification to determine if qualified leads behave differently than unqualified leads, but those qualification flags are set manually by the sales team on user records in the CRM.
In the Growth Stack, you can solve this problem by:
- Centralization – Pulling the relational CRM data into your centralized data store
- Computed Traits – Performing a query to associate CRM qualification flags with user emails/IDs in a user table
- Activation – Sending those computed customer traits to the product analytics tool, allowing the product analyze behavior for different segments of users
Implementing the Growth Stack is a journey in itself
You don’t need to implement every component of the Growth Stack at one time, very few companies do. Instead, you can take a step-by-step approach, starting with the central storage/compute later and building out from there depending on your specific needs.
While most companies who add a central storage/compute layer will eventually layer in all of the components of the Growth Stack, the KISS (keep it super simple) principle is key here. Implementing only what you need is the best practice you shouldn’t ignore because unnecessary complexity in your stack is never a good thing. For example, you’ll want to get a good handle on centralizing data in your warehouse before you add a pipeline to get that data out of the storage layer and back into downstream tools. You’ll avoid a lot of headaches by first solidifying your data models and working to understand which data points downstream teams actually require.
Step 1: set up a cloud data warehouse and feed it with your event data
Cloud data warehouse: the center of the Growth Stack
The centralized storage/compute layer is the cornerstone of the Growth Stack. The tool for the job is a cloud data warehouse. It’s the key that unlocks all the benefits of the Growth Stack.
This step is easy thanks to an array of solid data warehouses that offer self-serve plans to get you started. In fact, you can probably stand up a basic warehouse instance in half an hour.
Feeding your warehouse with your existing event and user profile data
If you made the right choice on the tooling you used to collect and route events and user profile traits in the Starter Stack, you’re in luck. Routing the raw payloads from that feed is now as simple as adding your warehouse as a destination in the integration layer.

Ideally, your event streaming solution automatically flattens the raw payloads into standardized schemas, which show up as a standard set of tables in your data warehouse. Different tools have different ways of structuring event and user profile data in the warehouse, but almost all of them provide at least two basic types of tables:
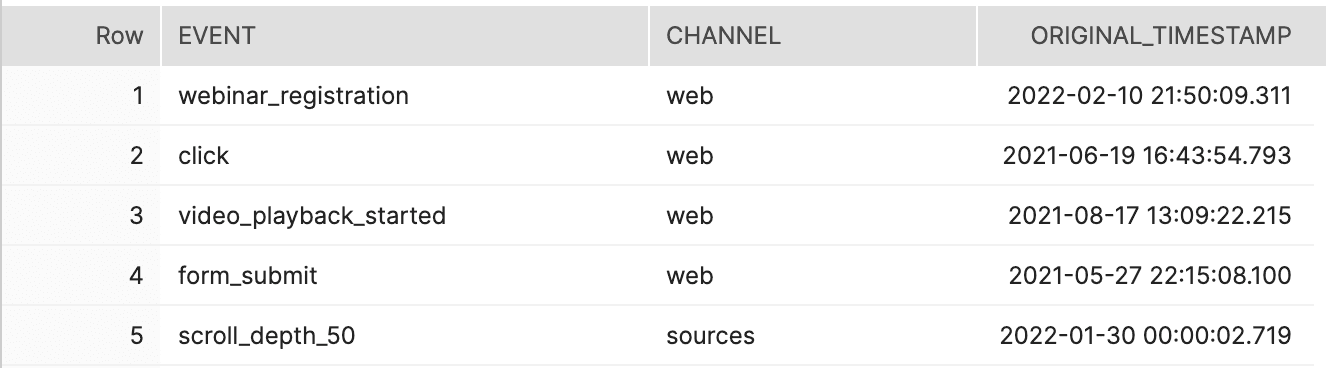
- User action tables, in which each row represents a user action (i.e., a single event performed by a user).
- For example, you’ll have a table for pageview actions, a table for click actions, a table for added_to_cart actions, etc.
- Note that various tools either combine all actions into one table, separate actions into their own tables, or provide both
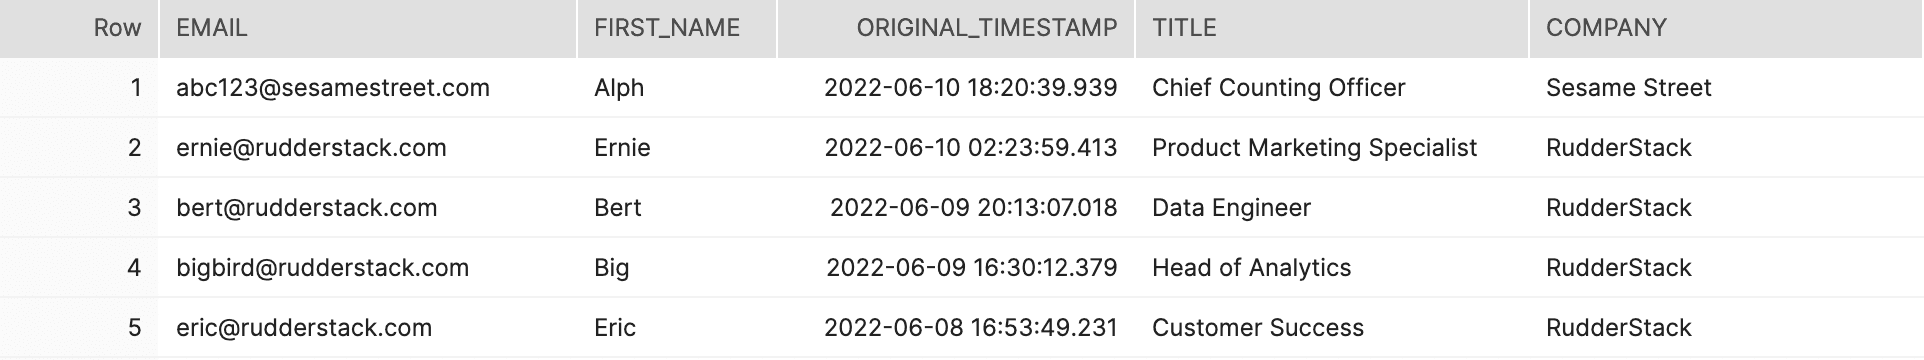
- User profile tables, in which each row represents a user and the traits that you’ve associated with that user
User action table:
User profile table:
At this point, you can already up your analytics game
Getting your raw event and user profile data into the warehouse is a light lift with the right tools, but it makes a huge impact. In the warehouse, you can write SQL to join user actions and profiles in any way you want, leaving the limitations of SaaS analytics behind.
Things get even more exciting when you combine this behavioral data with data that’s been siloed in SaaS tools.
Step 2: use ETL pipelines to eliminate SaaS data silos
This step focuses on pulling in relational data from silos across the stack. Because this is a different data type, it requires a different type of pipeline. These pipelines are traditionally referred to as ETL pipelines, which stands for Extract, Transform, Load. Let’s break this down:
- You want to extract relational data from other systems
- It needs to be transformed to match the data format in your warehouse
- Then you need to load it into warehouse tables
Most ETL tools load data in batch jobs that run on a schedule. For example, you might load your CRM data every 24 hours to make sure you have the latest information on a daily basis.
Similar to event data, this relational data is loaded into various tables. Data coming from SaaS tools often loads a table for each type of ‘object’ in the SaaS tool. Let’s look at the tables your CRM data might load:
- A Leads table for user records,
- An Accounts table for company records
- An Opportunities table for deals created by the sales team
Tables loaded by your payments system might be:
- an Orders table representing purchases
- a SKU table representing the product purchased
- a Customers table representing the users who made purchases
This is what we call a bi-directional data flow: data flows into SaaS apps, then out of SaaS apps, meaning these apps are both destinations for data and sources of data in the stack.

The power of centralized data
Centralizing your behavioral data and relational data in your warehouse is a huge step in modernizing your stack and improving your analytics. By joining various tables, you can answer all kinds of interesting questions. Here’s one example drawing from the tables mentioned above:
What are the top pageviews for qualified leads who have made more than 5 purchases in the last year?
With your behavioral, CRM, and payments data in your warehouse, you can join data from:
- The Pageviews table
- The Leads table (which has the qualification flag from sales)
- The Orders table
Once you join the data, you can answer the top 5 pageviews question in a matter of minutes with a simple query. That’s a big improvement from the hours or days of data munging it required before.
Step 3: use streaming sources to pull in event data from SaaS tools
This is perhaps the most neglected step in building out a Growth Stack, but it’s one of the most useful data flows. Relational data isn’t the only type of data produced by SaaS tools. Lots of SaaS platforms produce event data. Email platforms are a great example: email sends, opens, and clicks are all user actions, just like the behavioral data from your website or app. These events are critical for getting a complete view of the customer journey.
If you chose your infrastructure well in the Starter Stack phase, your existing system can ingest streaming events from modern SaaS tools. Practically, this means events from your email platform follow the same data flow as events from your website or app. The source is the only difference, one an SDK, and the other the SaaS app itself, which is really nifty.
This is another example of a bi-directional data flow, where the data destination is also a data source.
SaaS events in the warehouse
As you would expect, these events are loaded into tables in a similar fashion to other event tables, adding to the list of user actions you can query.
Streaming SaaS events directly to other SaaS tools
One often overlooked data flow that is extremely helpful is what we call streaming data loops, where data streaming from one SaaS app is routed through the event streaming infrastructure directly into another SaaS tool. For example, a product team might want to stream email events into their product analytics tool so they can analyze the impact of these events on user onboarding or activation. With a streaming data loop, email opens and clicks can be sent directly to the product analytics tool.

What if there isn’t a direct source integration with your event stream?
Inevitably companies run across legacy systems or new tools that don’t integrate directly with their event streaming infrastructure. Here, the flexible data layer from the Starter Stack phase pays significant dividends. The most flexible platforms offer Webhook sources that allow you to ingest data sent from other platforms without a direct integration. You’ll have even more flexibility if the event streaming infrastructure has a transformations layer that allows you to interact with the payload. With webhook sources, flexible event streaming infrastructure, and transformations, you can do some pretty cool stuff. You can even turn offline events like sales calls from your CRM into actual events in the event stream.
Step 4: build a complete customer profile and customer journey in your warehouse
At this point you have collected all of your customer data in the warehouse:
- Behavioral data and user traits from your websites and apps
- Relational data from SaaS tools and other systems across the stack
- Event data produced by SaaS apps
Now you’re ready to leverage the compute part of the centralized storage/compute layer. In terms of specifics, the sky's the limit because you can query the data in any way you want, but you can start by building complete customer profiles and complete user journeys.
Complete customer profiles - many people call this “customer 360” or a “single view of the customer.” Whatever the terminology, the concept is simple: you join every customer trait from every tool into a master table of customer profiles.
Complete customer journeys - this concept is similar, but instead of traits, you’re aggregating every user touchpoint (pageviews, add_to_carts, purchases, email clicks, etc.) with each user. This gives you a detailed map of everything each customer has done.
Needless to say, the insights that can come from querying complete profiles and journeys can be extremely powerful.
Optional: managing computation with a transformations engine on the warehouse
Even though you have all of the data in your warehouse, building queries for things like a complete customer journey will still require a non-trivial lift if you have a lot of data and fragmented user touchpoints. One way you can mitigate this challenge is to leverage a third-party transformation engine that runs on the warehouse. This makes building, running, and managing core queries easier and more accessible. This tooling is called a metrics layer or analytics engineering layer. No matter what it’s called, the benefit is that it makes modeling in the warehouse easier.

Step 5: push completed profile data and computed traits out of the warehouse to the rest of your stack
Driving insights with complete data is great, but the biggest win of the Growth Stack is sending that data to downstream tools so teams can act on it. This introduces another new data flow where data is pulled from the warehouse and sent to downstream tools.
The pipeline used for this data flow is called a reverse ETL pipeline, because it is the inverse of the ETL data flow.
Using reverse ETL pipelines is straightforward:
- Produce a materialized table in your warehouse that contains the data you want to send to downstream tools
- Map the data points in the table (i.e., column names) to the fields in downstream platforms
- Run (or schedule) the sync job

Note that in the Growth Stack, the warehouse itself is bi-directional, serving as both a destination and source.
You can do many interesting things with reverse ETL pipelines, but most companies start with two primary use cases–syncing a complete customer profile to every tool, and computing traits and sending them to every tool.
Syncing a complete customer profile to every tool
Remember the master table of customer profiles we mentioned above? With reverse ETL you can send that master users table to downstream SaaS tools so that every system has the same, comprehensive customer profiles. Said another way, every tool can use every user trait from every other tool. This enables all sorts of powerful segmentation and analytics use cases in downstream tools.
Computing traits and sending them to every tool
Unifying existing traits is great, but the real power comes when you compute traits using various data points in the warehouse. Let’s say your company has the following definition for high-value customers:
- Have made 5 purchases over $100 within the last year
- Are between 25 and 45 years old
- Visit the website at least once per week
With all of the data in the warehouse, you can easily join purchase data, demographic data from the CRM, and pageview data from the event stream to produce a table of high-value users with a “high value” flag.
With reverse ETL, you can send that computed high value tag from the warehouse to all of your downstream tools. That enables Marketing to easily create dedicated email campaigns and Product to analyze flows and usage for that specific segment in their product analytics tool.
The full Growth Stack architecture
When you put all of those pieces together, here’s what the stack looks like:
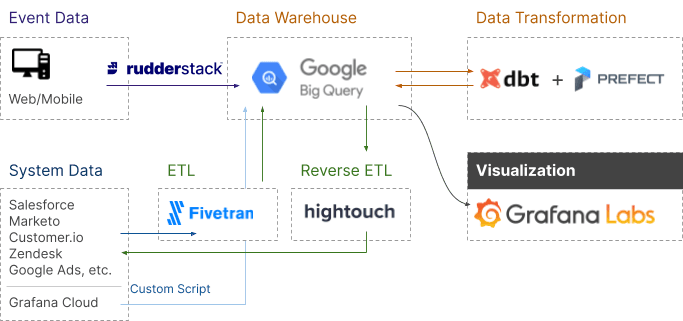
To make this even more real, let’s look at an example architecture from an actual company. Grafana is an open-source analytics and visualization tool that offers querying, alerting, and more to help companies understand their data. They wrote about the stack they use to drive business intelligence and included an excellent architectural diagram of the Growth Stack.
Tooling and technical review
The Growth stack adds several key components to the stack:
- A cloud data warehouse
- ETL pipelines
- Reverse ETL pipelines
- Optional but recommended: data transformation engine on the warehouse
Choosing the right tools for the job
Here are a few guidelines to help you choose the best tools for your Growth Stack.
Cloud data warehouse
Most modern warehouse solutions are really good. Here are a few specifics to look for:
- Separation of storage and compute functionality
- Flexible ingestion, which you can often determine by the number of integrations it has with event streaming and ETL data sources
- Scalability and speed– these become increasingly important as your data volume grows
ETL pipelines
ETL pipelines have been around for a long time and there are lots of options, but here are some important characteristics to prioritize:
- A robust library of data sources
- Strong documentation on schemas and load functionality
- Strong scheduling functionality–integration with orchestration tools is a plus to mitigate future complexity
- Optional: configurable transformation (depending on your specific needs, you might want to transform the data in specific ways before it is loaded into the warehouse)
Reverse ETL pipelines
Data engineers have been sending data out of databases in various ways for a long time, but the emergence of dedicated SaaS reverse ETL pipelines is fairly recent. Here’s what to keep an eye out for:
- A robust library of warehouse and database integrations because you’ll eventually want to pull from your warehouse and even production databases
- Query functionality to enable you to query from the reverse ETL tool itself
- Strong scheduling functionality (integration with orchestration tools is a plus)
- A Data mapping UI for non-technical users
- Code data mapping functionality enabling technical users to do more complex configuration
Outcomes from implementing the Growth Stack
You don’t have to implement every part of the growth stack to drive impact. You get incremental value at each step, and when you do put together the complete stack, the results are significant:
- Eradication of data silos across the stack
- A single, centralized source of truth for every customer data point
- Comprehensive and complete user profiles
- Full visibility into customer journeys
- The ability to perform almost any kind of analytics on any customer data
- The ability to quickly derive valuable computed traits of any kind
- The ability to send data from your warehouse to your entire stack for use in both analytics and business tools
When all of those powers combine:
- Your analysts and downstream teams can focus on deriving insights from analytics, not dealing with incomplete or dirty data sets
- Your downstream teams can leverage any customer data point from anywhere in the stack in their work, making optimization significantly easier
- The data team can spend time partnering with downstream teams to build more interesting data products and use cases, instead of wasting time on low-level integrations work, data cleanup, or manual data syncs
- Perhaps most importantly, your leadership team will have more insight than they’ve ever had, without the need for data fire drills
When have you outgrown the Growth Stack?
It can take a long time to outgrow the Growth Stack. A small mid-market company that starts with a cloud data warehouse implementation and adds additional pieces of the Growth Stack as business requirements demand, could still be running the Growth Stack as a large publicly traded company.
The limitation of the Growth Stack, though, is that it drives deterministic analytics and activation. The Growth Stack is the best possible way to optimize your business based on a complete, accurate data-driven view of what has happened.
When companies at scale begin to master deterministic analysis, the next phase of growth requires anticipating what is likely to happen in the future and acting on it before it does. We call this predictive analytics and activation.
If you’re at a point where you’re beginning to think about predicting customer churn, making personalized recommendations, or customizing your website/app experience for different users, you’re going to need to leverage machine learning models and move from the Growth Stack to the ML stack.
Published:
June 14, 2022
Get started today
Start driving better business outcomes with your customer data in less than a week
Book a demo
Explore use cases with an expert and see RudderStack in action.
Implement RudderStack
Start collecting and enabling real-time customer data everywhere it's needed.
Drive better outcomes
Supercharge your analytics, product, growth, and AI teams.