Blog
How to replace Google Analytics with RudderStack, Snowflake, dbt, and Hex
How to replace Google Analytics with RudderStack, Snowflake, dbt, and Hex

DG Ellis
Data Engineer
20 min read
September 21, 2026

Google Analytics 4 cannot answer the questions that matter once you have a warehouse: which marketing channel drives accounts still paying at month 6, which pages appear on the path to closed deals, what a specific prospect looked at before booking a demo. Each of these requires joining web behavior to CRM data at the individual level. GA4 keeps web analytics in its own silo and provides no path to that join at any tier.
That gap compounds the limits most teams already know. GA4's exploration reports are sampled above roughly 10 million events, so traffic volumes that matter most produce estimates, not exact counts. User-level data is retained for a maximum of 14 months (2 months is the only alternative setting), meaning any cohort analysis older than a year quietly disappears. GA4 shares the same client-side collection machinery as Google's ad tags, making it vulnerable to the same ad blockers; a meaningful portion of site traffic is never recorded. AI assistants (ChatGPT, Perplexity, Claude, and Gemini) strip the Referer header when they link to external pages, so traffic arriving from those sources lands in "unassigned" unless you classify on utm_source in SQL. And if the answer to these limits is GA4 360, the entry price is $150,000 or more per year, quote-only, and even at that tier there are no native row-level joins to CRM or revenue data.
The alternative described here: Collect first-party events with the RudderStack JavaScript SDK, land them in Snowflake, resolve identities using RudderStack Profiles, shape the resolved data with dbt, and build the analysis layer in Hex.This is not a reference architecture; it is a real production build, sanitized for external use, with every figure drawn from something that shipped. A team with a dedicated analytics engineer can stand it up in a handful of days. The data modeling and planning runs roughly 5-10 hours; the Hex dashboard takes about 1-2 hours, mostly hands-off while Hex's AI agent builds the charts from a spec. Instrumentation time varies by site state and is the piece worth scoping carefully up front.
The stack
Three layers, each with one job. RudderStack collects events and routes them to Snowflake. dbt models the raw tables into mart-layer views the BI tool can query without containing business logic. Hex queries the marts and renders the dashboard.
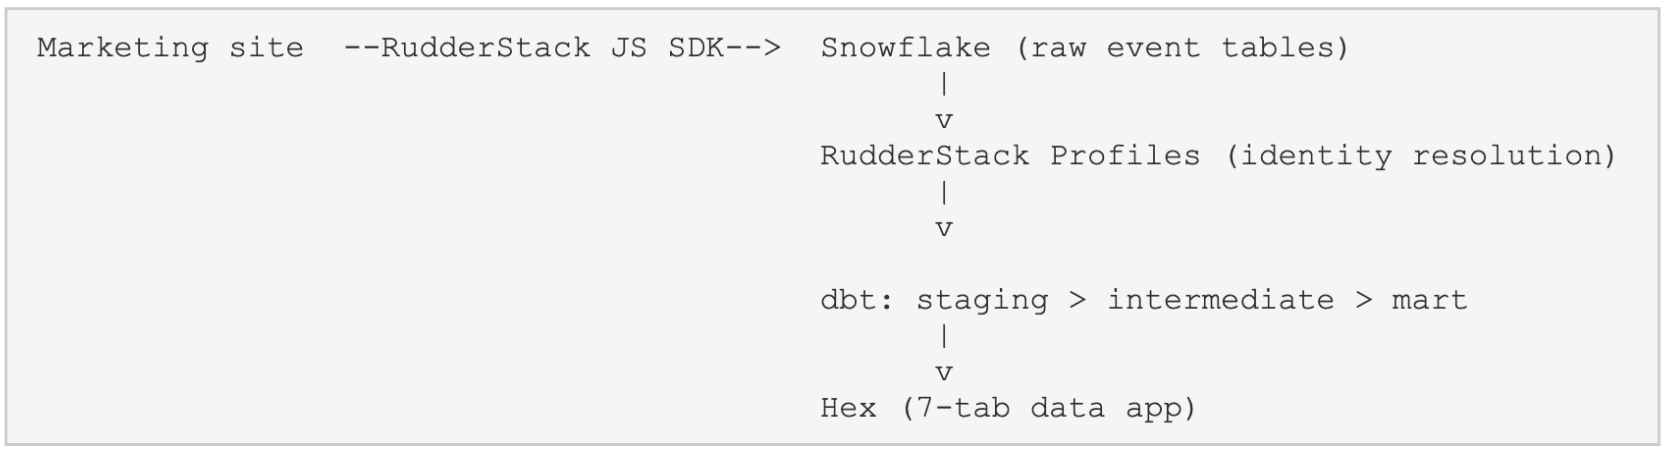
Effort to stand it up, stated plainly:
Phase | Estimated time | Notes |
|---|---|---|
Instrumentation | Highly variable | Depends entirely on the current state of the site. The hardest to scope. |
Data modeling | ~5 - 10 hours | For someone comfortable with dbt and window functions |
Hex dashboard | ~1 - 2 hours | Mostly async; Hex's AI agent builds while you do something else. |
Step 1: Instrumentation
Everything in this stack runs on five event types. Sessions, bounce rate, time on page, new-versus-returning, channel attribution, and conversion tracking all derive from these five calls. No custom scroll-depth events, no engagement pings, no click instrumentation required.
Events | RudderStack calls | Powers |
|---|---|---|
Page load | page() | Traffic, sessions, top pages, channels |
Form submite | track('form_submitted') | Conversions |
Identify | identify() | Anonymous-to-known stitching |
Meeting started | track('meeting_started') | Funnel, conversion |
Meeting booked | rack('meeting_booked') | Primary conversion, pipeline |
The last two events are specific to a B2B sales motion with a self-scheduled demo flow. Substitute your own conversion events (order_completed, subscription_started, trial_activated) wherever the funnel logic applies. The modeling patterns in later steps are identical regardless of event name.
One rule matters more than anything else in this layer:
On first page load, capture UTM parameters and the referrer into a first-party browser cookie, and attach them to every subsequent event in that session.
Without this, a visitor who arrives from a Google ad, browses three pages, and then submits a form will have their form submission attributed to the last page they visited, not to the ad that brought them. Attribution is silently wrong and there is no way to correct it after the fact. Set the cookie once on entry and read it on every subsequent event. This is the single highest-leverage line of instrumentation code in the entire build, and it must happen in the SDK setup, not in SQL.
One identity resolution capability is built into the RudderStack SDK itself: anonymous activity is automatically stitched to known activity the moment a user identifies, with no additional configuration. For many sites this is sufficient. The gap appears when more than one SDK is in play across different systems. Each SDK resolves identity within its own scope and has no visibility into what other SDKs are tracking, which means a user's full journey can remain siloed even after individual identification events fire. RudderStack Profiles closes that gap at the warehouse level, picking up where the individual SDKs leave off and completing the identity graph across all sources. dbt then receives that resolved data as its input, which is what makes the person journey and pipeline influence views accurate.
One underrated benefit of warehouse-native collection is that the raw event history stays correctable. When instrumentation changes (a renamed property, a signup flow that splits in two, a form that moves from an embedded provider to a native element), a dbt model reconciles old and new and keeps the full history intact. An out-of-the-box tool aggregates on ingest, so the past is locked the moment it lands. The warehouse keeps every raw event, so past instrumentation errors become data to model rather than data that is gone.
Step 2: Data modeling
The modeling work is what GA4 was doing invisibly. Session boundaries, channel grouping, bot filtering, geography, bounce rate, time on page, and new-versus-returning are all GA4 defaults. In the warehouse they are SQL models someone has to write, own, and defend. That transfer of ownership is the main tradeoff. The patterns below cover all of them, though their accuracy depends on one prerequisite: identity resolution. dbt can handle identity resolution, but the complexity varies significantly by situation. RudderStack Profiles solves that part, and dbt then does the modeling on top of resolved data.
Layer 1: Union and channel grouping
Real sites typically have more than one event stream. A complete implementation might union marketing-site pageviews, on-site form submissions, webhook submissions from an embedded form provider, identify calls, and app-side identifies used for cross-domain stitching. The output is one flat table, one row per web event, with a consistent schema: event_id, anonymous_id, email, event_type, event_at, page_url, page_path, referring_domain, UTM parameters, user agent, IP, and page title. Everything downstream is generic. This is the only layer that is genuinely specific to your site, which is why the open-source repository ships this model as a worked example with a "rewrite this one" callout rather than as reusable code.
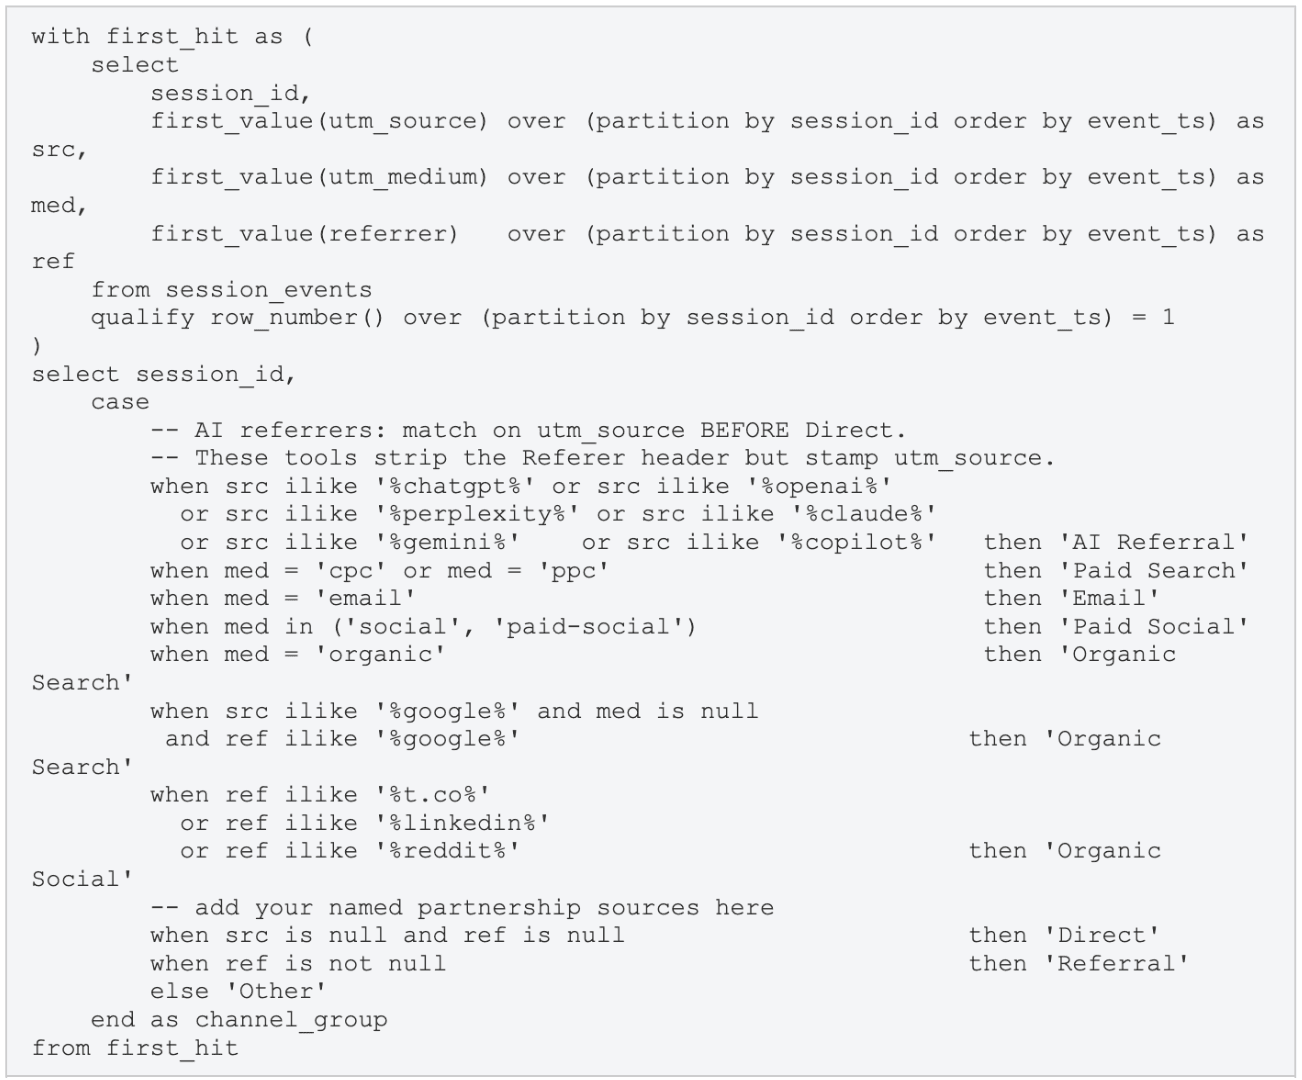
Channel classification belongs in this layer, and two design choices make it robust. First: channels are evaluated in strict priority order with no overlapping predicates, so a source that could qualify as either paid or organic social resolves deterministically. Second: AI tools are matched on utm_source before Direct, not on referrer. AI assistants strip the Referer header when linking to external pages but do stamp utm_source: chatgpt.com, claude.ai, perplexity.ai, and similar. Classifying on referrer alone files those sessions under Direct. Matching on utm_source and evaluating AI Referral ahead of Direct keeps that channel visible, which is a 2025-and-later concern that most inherited channel logic predates.
In production, channel classification runs as a seed CSV (columns: pattern_type, pattern_value, channel, priority) rather than a 130-line CASE statement. A marketer can add a row when a new AI referrer appears. Named partnership domains appear as explicit rows. Priority ordering becomes data you can inspect rather than control flow you have to read.
Layer 2: Identity resolution
Retroactive email stitching across anonymous_id: if any event for an anonymous ID ever carries an email address, that email attaches to all of that anonymous ID's events, past and future. The most-recent non-null email wins on conflict. This is what makes it possible to look up a specific person later and see their full pre-identification browsing history.
Flag anonymous IDs that resolve to two or more distinct emails (is_multi_email_anon). Shared devices, shared browsers, and kiosk machines all produce this pattern. Exclude them from any analysis that binds behavior to an individual, or one person's browsing will show up on another person's pipeline record.
For most use cases, identify() calls in the web stream provide a working starting point: any visitor who submits a form or signs up gets stitched on the first identify call. But individual SDKs only have visibility into their own scope and cannot stitch a user's full graph across systems. RudderStack Profiles is the complete solution: it assembles the identity graph holistically across all sources, resolving the cross-SDK gaps that individual identify() calls leave behind. On Enterprise plans, Profiles materializes that resolved graph in Snowflake, and dbt models build on top of it. The person journey and pipeline influence views are only fully accurate when identity is resolved at this level.
Layer 3: Sessionization
A session ends after 30 minutes of inactivity, the same boundary GA4 uses, which makes session counts directly comparable during the parallel-running period. Sessionization is only as accurate as the IDs going into it; RudderStack Profiles ensures those IDs are fully resolved before this layer runs.
The implementation: lag() over each anonymous ID's events ordered by timestamp, flag any gap greater than 1,800 seconds as a new session start, run a cumulative sum of those flags to get a session sequence number, and concatenate with the anonymous ID to produce a session key. Sessionize every event type, not just pageviews. A form submission that follows the last pageview must attach to the correct session, not start a new one.
Build the sessionization model as a full table rebuild, not an incremental. The window functions need each anonymous ID's complete event history to place session boundaries and compute time-on-page across day edges. A naive event_date-incremental model mis-splits sessions that straddle midnight; the session boundary in the evening becomes a separate session the next morning, and the session count inflates. At the scale of a marketing-site event stream, a full table rebuild is fast.
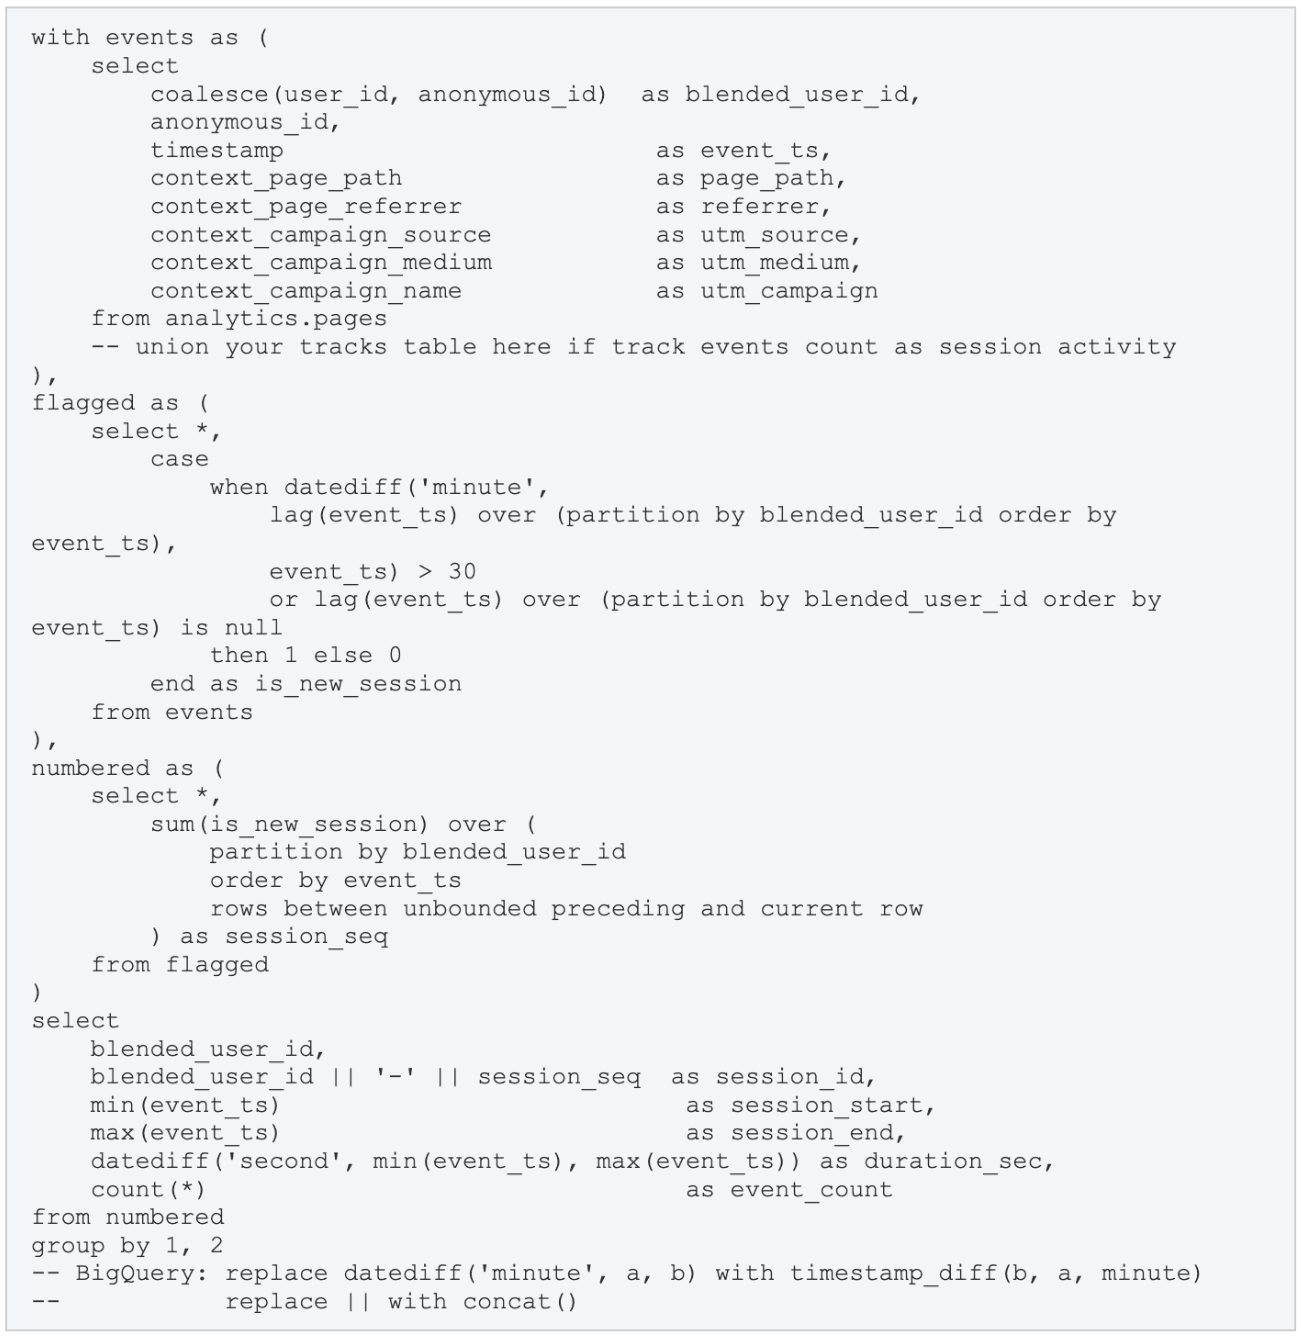
Note: This sample illustrates the pattern. In the repository, sessionization reads from int_web_events_identified, so every event already carries a resolved person_email from web identify calls and, optionally, the RudderStack Profiles identity graph. Session boundaries are still computed per anonymous_id; identity resolution does not change session counts or first-touch channel. It decides which person a session belongs to, which is what the person journey and pipeline influence marts depend on.
Layer 4: The metrics GA4 gave you for free
Each of the standard GA4 metrics is a decision when you own the model. Here is how the production build defines each one.
Bounce rate: a single-pageview session that did not convert. A one-page session that ends in a form submission counts as engaged, not a bounce, so high-converting landing pages read correctly. There are two distinct bounce-rate calculations in the mart layer and they must be labeled separately: session bounce rate, defined as bounced sessions divided by total sessions, and landing-page bounce rate, defined as entry-page bounces divided by entrances. These two numbers reconcile only at the site-wide total, not per channel, device, or page slice. Mixing them produces irreconcilable dashboard figures.
Time on page: the gap to the next event in the same session, capped at 30 minutes. Values above that threshold are set to null rather than counting idle tabs as engagement. The last pageview in any session has no successor and is also null. Label the metric "Avg time on page (measured views)" in the dashboard so readers understand it is a floor, not a ceiling.
New versus returning: derived from the session sequence number per anonymous ID. Only page-bearing sessions count; app-only sessions that contain no marketing pageview should not seed the returning flag.
Bot filtering: an explicit model combining user-agent matching and behavioral heuristics. Filtered bots are excluded from the traffic mart so every downstream conversion rate has a clean denominator. Bots are flagged but not dropped from raw data, so the filter logic remains auditable.
Geography: derived from IP via a lookup table, with an explicit sentinel value for unmatched IPs so they never appear as a real country in geo charts.
Channel grouping uses the first touch of each session and produces a stable, reusable label. The SQL below shows the working implementation, with AI Referral positioned before Direct, the design decision that keeps AI-sourced traffic visible:
Layer 5: Marts
The mart layer is what Hex queries. No business logic lives here, just report-ready tables, each shaped for one part of the dashboard. When a new consumer appears (a Reverse ETL job, a different BI tool, a data export), you add a mart rather than fork a query.
Mart | Grain |
|---|---|
web_traffic_daily | Day x channel x device category x country (bots excluded) |
web_page_performance | Page URL x day |
web_conversions | One row per conversion event |
web_pipeline_influence | Page x channel x opportunity month x record type |
web_person_journey | One row per event per resolved person (PII) |
Note: Two of these marts, web_pipeline_influence and web_person_journey, are only fully accurate when identity resolution is complete. RudderStack Profiles is what makes that accuracy reliable.
Step 3: The dbt architecture
The full model directory follows a three-layer pattern: raw tables as landed by RudderStack, intermediate models that solve the hard problems, and marts that the BI layer reads. Each layer has a single job: raw tables land untouched, intermediates handle the transformations, marts expose clean grain.
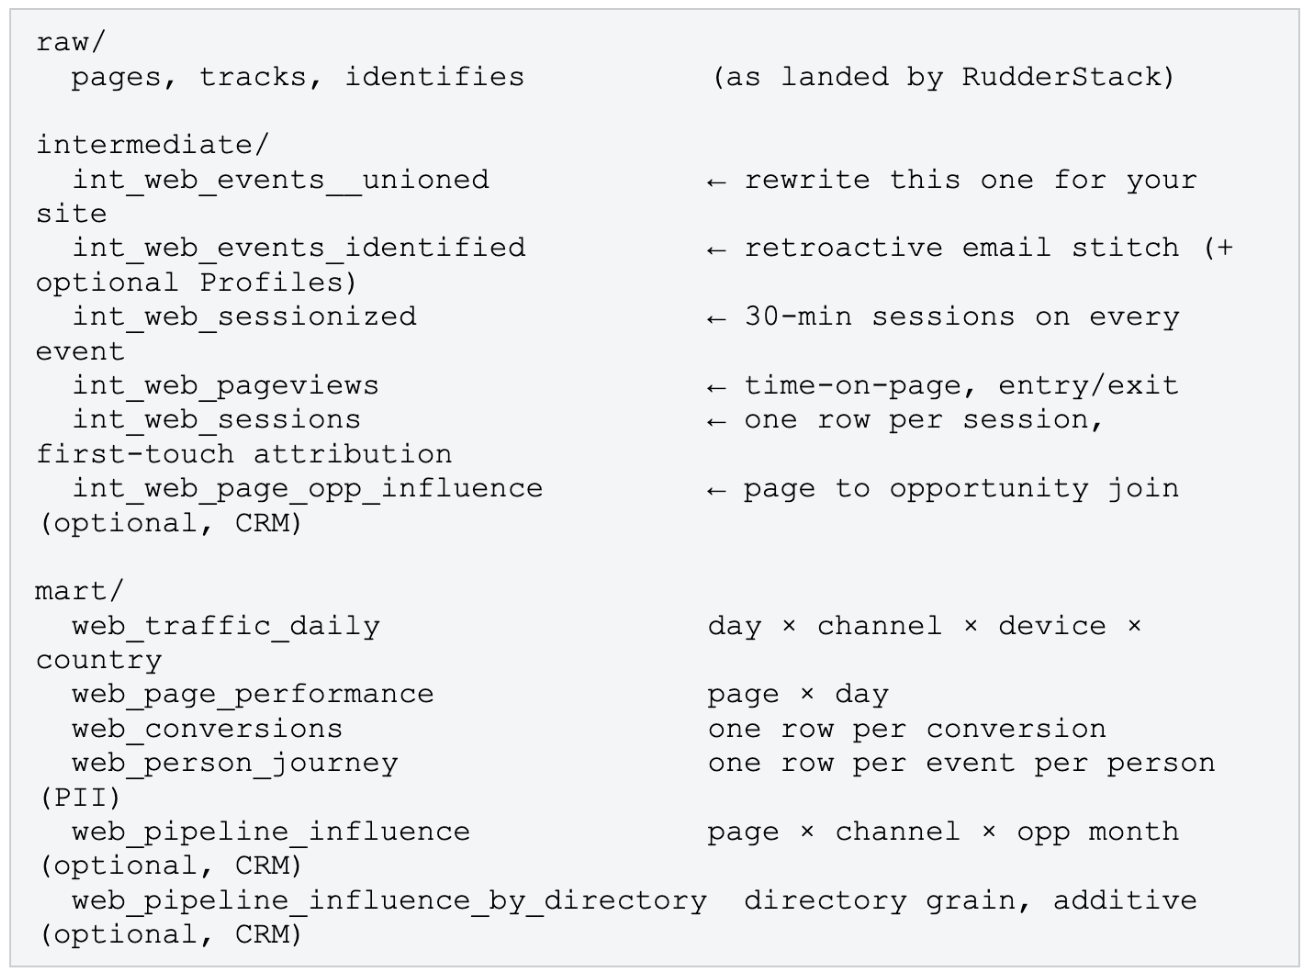
The key design decisions are the ones to document before writing a line of SQL, because each one affects multiple downstream models:
Area | Decision |
|---|---|
Session window | 30-minute inactivity. A mid-session UTM or referrer change does not split the session. Channel, UTM, and device are assigned once from the first touch. |
Incrementality | Full table rebuild. Window functions need full anonymous_id history. An event_date-incremental model mis-splits sessions at day boundaries. |
Bounce | Single-pageview session that did not convert. |
Time on page | Next-event delta within the session. Last pageview: null. Values above 30 minutes: null. |
Exit rate | Per page: The percentage of that page's pageviews that were the last in their session. |
New versus returning | First-ever event timestamp per anonymous_id. Page-bearing sessions only. |
Device | Parsed from context_user_agent. Order matters: tablet before mobile; iOS Chrome and Firefox before Safari; iOS before macOS. |
Bots | Flagged and excluded from the traffic mart. Not dropped from raw data. |
Schema tests run in CI: unique on session_id, not_null on all foreign keys, rate fields bounded between 0 and 1, pageview counts reconciled between intermediate and event tables, and a person-trail test that picks one identified person and asserts their journey row count and sequence match the raw events.
Step 4: Building the Hex dashboard
The dashboard construction follows a five-step agentic workflow. The process generalizes to any BI tool with AI authoring capability, though Hex's native AI agent makes the chart construction step unusually fast.
First: record the requirements conversation with the marketing team. Ask what they actually look at, not what they think they need. Transcripts are more reliable than notes for surfacing the reports people use daily and never think to mention.
Second: walk the out-of-the-box equivalents, in this case, GA4's default report set, specifically to catch reports people take for granted and would never think to ask for. Bounce rate by landing page, new-versus-returning breakdowns, time on page: none of these get mentioned in a requirements conversation because everyone assumes they will exist.
Third: combine stakeholder requests and out-of-the-box equivalents into a prioritized report list, then work backward: given the intermediate models already built, what mart grain do these reports need?
Fourth: plan with an AI agent: map intermediate models to required marts to dashboard structure. Then hand that plan to Hex's AI agent with specific table-and-column instructions and let it build the chart UI. The agent is good at chart construction when you are precise about which mart table and columns to use; the job is providing that precision, not deciding the semantic definitions, which the plan already captured.
Fifth: close the loop. Export the finished dashboard back to the planning agent and have it cross-check each visualization against the data models, confirming that each chart reads its intended table and column and aggregates the way the model expects. It is a fast, automatic verification pass across the whole app.
The resulting dashboard has seven tabs: Overview, Acquisition, Audience, Behavior, Conversions, Pipeline Influence, and Email Journey Lookup. The first six are published as one app. The seventh, which surfaces email addresses and full browsing histories, is a separately-published app with explicit, deliberate permission grants.
Five implementation details the working version gets right:
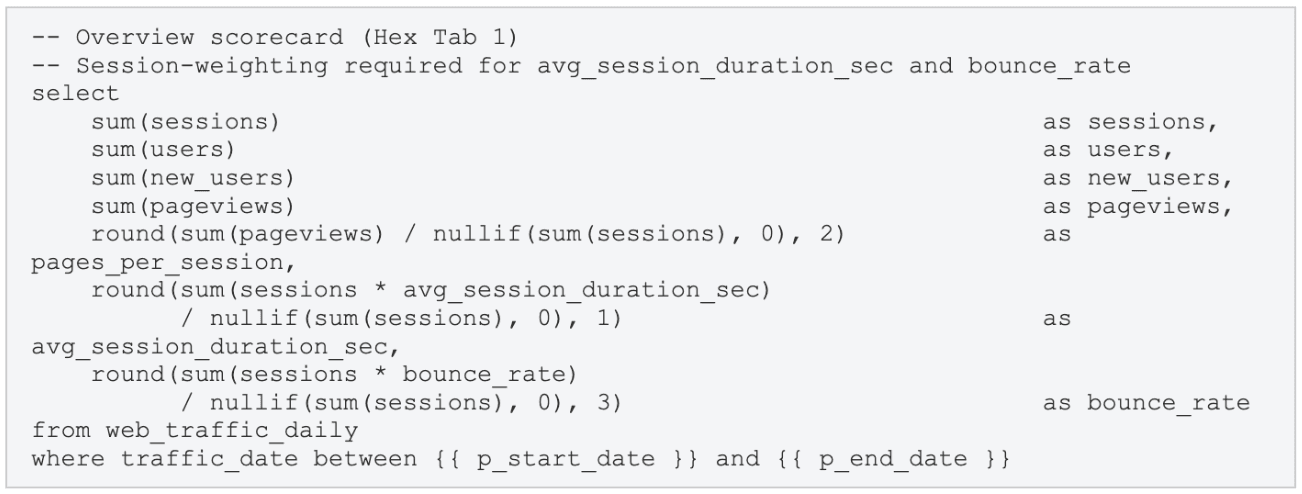
Session-weighted rollups: rolling daily bounce_rate up to a week or month requires sum(sessions * bounce_rate) / sum(sessions), not avg(bounce_rate). A 3,000-session day must count for more than a 3-session day. The same pattern applies to avg_session_duration_sec. A plain average of daily averages produces wrong aggregate numbers.
Distinct bounce rate labels: session-level bounce rate and landing-page bounce rate are different calculations with different denominators. Both appear in the dashboard, labeled "Session bounce rate" and "Landing-page bounce rate" respectively. A chart that says "bounce rate" without qualification is ambiguous across these two numbers.
Current incomplete period visible: trend charts include the in-progress week. Marketers check dashboards mid-week and need to see the week so far, even though it is not complete.
Ratio thresholding: the landing-page bounce chart uses having entrances >= 25 to suppress singleton noise. A page with two entrances should not dominate the sort on a bounce rate of 100%.
PII tab gated separately: web_person_journey contains person_email paired with full page paths, session times, and conversion events. It is published as a separate Hex app with tighter access controls rather than a tab on the company-wide dashboard.
The scorecard query for Tab 1 illustrates the session-weighting pattern that must be applied consistently wherever you roll up daily ratio columns:
The report GA4 can't give you: Pipeline influence
Pipeline influence is not attribution.
An opportunity touched by N pages contributes its full dollar amount to N rows in the table. Those rows do not sum to total pipeline. The metric answers which pages and channels show up on the path to pipeline; it ranks them by the pipeline they touch; it does not allocate credit. Always present pipeline influence figures as a ranking, never as a sum.
The definition: a page influenced an opportunity when someone on that opportunity's account viewed the page for more than 20 seconds before the opportunity was created. The 20-second threshold filters out drive-by page loads and focuses the metric on visits with genuine engagement. All pageview and opportunity timestamps are compared in a single timezone (UTC), which ensures that pageviews in the hours immediately before an opportunity is created are captured, not just those from days earlier.
The pipeline influence view defaults to New Business. Existing-customer contacts browse documentation heavily, so renewal pipeline distorts the report significantly when mixed with new business. The record_type dimension carries New Business and Renewal as distinct values; always specify which you are reading.
Roughly 40% of opportunities in this production build have at least one qualifying pre-creation pageview. The remaining 60% simply did not browse the marketing site in that window. The coverage figure is itself a useful read on the funnel: it shows how much of new-business pipeline was web-visible before it was created.
The email journey lookup is the other half of this section, and the view that had the strongest reaction in the session where this build was reviewed. Type any email address into the Hex parameter and the mart returns that person's complete chronological trail: every page visited in order, the channel that brought them, time spent on each page, any conversions, and the campaigns attached to each session. This is structurally impossible in GA4 at any tier; it requires joining behavioral data to CRM data at the individual level, in the same system, on a live query. The query behind it:
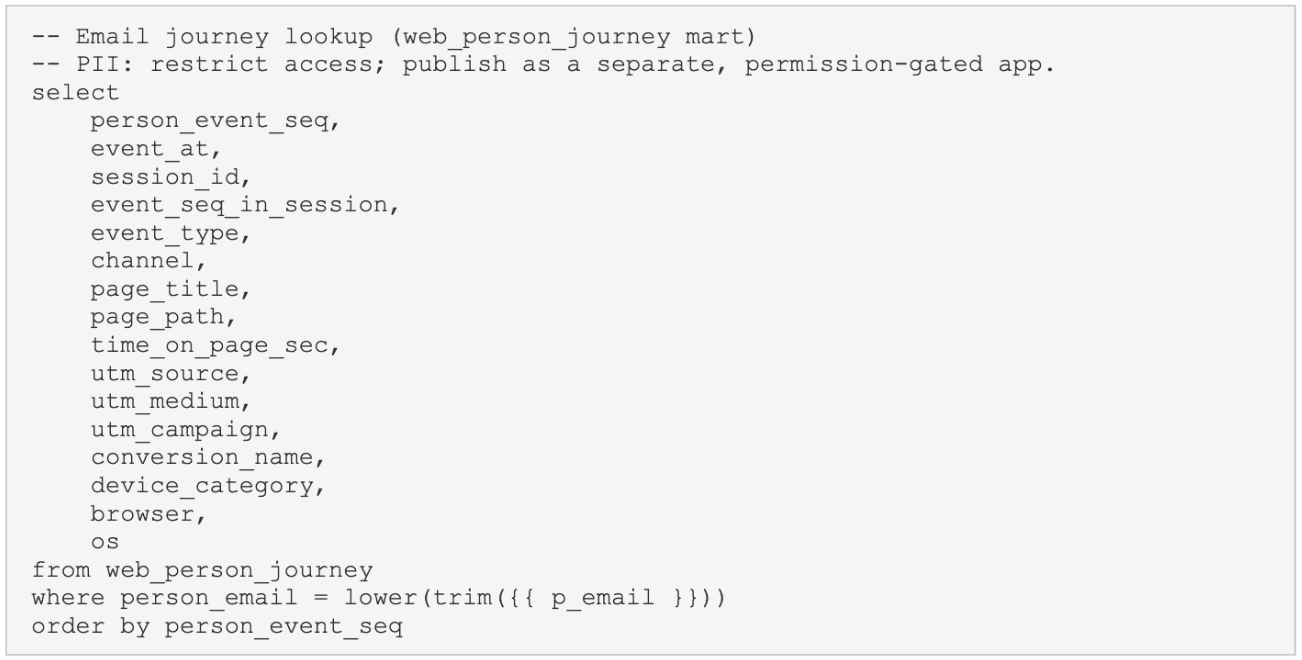
Treat web_person_journey as identified PII. The mart contains person_email paired with full page paths, session times, and conversion events. Publish the email lookup as a separate Hex app with explicit, deliberate permission grants. Do not add it as a tab on the company-wide dashboard without a deliberate access-control decision.
Where RudderStack fits
RudderStack is the agentic CDP. In this stack it handles collection, identity, and routing, the three layers that sit upstream of every mart table described in this article.
The JavaScript SDK instruments the five events and lands every raw page, track, identify, and conversion event in Snowflake as a queryable row. The same event stream fans out to GA4, ad platforms, and any other destinations without re-instrumenting the site. Destinations are added or swapped without touching application code.
Profiles handles the identity resolution layer, stitching anonymous marketing-site sessions to identified product users across sources. This is the join that makes the person journey view complete for users who identified in the product application but never submitted a form on the marketing site. For all other plans, identify() calls in the web stream cover the majority of real-world identification cases.
One practical note on migration: Keeping the GA4 destination active costs nothing. The event stream fires to both Snowflake and GA4 simultaneously. Marketing retains the familiar interface for quick campaign checks, frequency reports, and anything that does not require a CRM join. Both destinations run in parallel indefinitely.
Tradeoffs to know before you start
These five items surface reliably in month two of projects that did not discuss them in month one.
You are rebuilding what GA4 gave you for free. Sessionization, channel grouping, bot filtering, geography, bounce rate, new-versus-returning, and time on page are all GA4 defaults that become SQL models the moment you leave the tool. The patterns in this article cover all of them, and the open-source repository ships working versions. But ownership transfers to your team; someone has to maintain, update, and defend those definitions as the business evolves.
Someone must own the semantic layer. The first disagreement on any warehouse analytics project is "what is a session" or "what counts as active." GA4 made that call invisibly. Now marketing, product, and finance must reach explicit, documented agreement before dashboards go live, or every team runs its own SQL and the numbers never reconcile. Budget time for that alignment before the build starts, not after.
Marketing loses self-serve during the transition. Until the Hex dashboards are live, every question routes through an analyst. Budget for the dashboard layer up front and build it before announcing the transition. The gap between turning off GA4 and having replacement dashboards ready is where adoption dies.
Your numbers will not match GA4. Expect 5-15% variance. Different sessionization definitions, explicit bot filtering, and the absence of Google-side modeling all produce different counts from the same underlying traffic. This is expected behavior, not a sign of error. Run both stacks in parallel for a quarter to build stakeholder confidence before cutting over, and brief stakeholders on the expected variance before the discrepancy causes an unnecessary meeting.
This is not free. RudderStack collection, warehouse compute, storage, and BI seats are real line items. The payoff is capability and ownership: exact data, unlimited history, and analysis GA4 cannot produce at any tier. Framing the project as a cost reduction sets expectations it cannot meet.
Summary
Warehouse-native web analytics is five events, three dbt layers, and a Hex dashboard that takes approximately 5-10 hours of modeling plus 1-2 hours of Hex work to build. The result is exact, joinable, unlimited-history data sitting next to CRM, product, and revenue in the same warehouse. The reports that make the argument are not prettier versions of GA4's bounce-rate chart; they are the reports GA4 cannot produce at any tier: pipeline influence by page and channel, and the per-person journey lookup that shows a sales rep exactly where a prospect went before they booked. The effort is real and scoped. The capability is genuinely different.
FAQs
Data modeling and planning runs approximately 5-10 hours for someone comfortable with dbt and window functions; the Hex dashboard takes about 1-2 hours, mostly hands-off while Hex's AI agent works. Instrumentation time is highly variable; it depends on the current state of the site, the number of event sources to union, and how much UTM and cookie logic already exists. The most time-consuming part in practice is not the modeling; it is instrumentation and aligning stakeholders on metric definitions before dashboards go live. A team with a dedicated analytics engineer can stand up the full stack in a handful of days.
No. A 5-15% variance is expected and is not a sign of error. Different sessionization windows, explicit bot filtering, and the absence of Google-side modeling all produce different counts from the same underlying traffic. The goal is not to replicate GA4; it is exact, queryable data owned by your team. Run both stacks in parallel for a quarter to build stakeholder confidence before cutting over.
Five: page() for every page load, track('form_submitted') for form submissions, identify() for email capture and user identification, and two conversion-stage events suited to your funnel: meeting_started and meeting_booked in the B2B example here; substitute order_completed, subscription_started, or your own conversion events. Critically: capture UTM parameters and the referrer into a first-party browser cookie on the first page load, and attach them to every subsequent event in that session. This one implementation detail determines whether channel attribution is correct.
Yes, and this is the recommended approach during and after migration. GA4 is one destination in the RudderStack event stream. The same events fire to both Snowflake and GA4 simultaneously. Keeping GA4 active costs nothing. Marketing retains a familiar interface for quick campaign checks while the warehouse stack handles analysis that requires joins and exact counts. Most teams keep GA4 running as a lightweight secondary destination indefinitely.
Pipeline influence measures the pipeline dollars associated with opportunities whose account contacts viewed a page for more than 20 seconds before the opportunity was created. It does not allocate credit; an opportunity touched by N pages contributes its full dollar amount to each of those N rows. Read the metric as a ranking of pages and channels by the pipeline they touch, never as a sum. Attribution would attempt to assign a fraction of pipeline credit to each touchpoint; pipeline influence makes no such allocation and answers only the question of which pages and channels show up on the path to pipeline. The report requires a warehouse-and-CRM join and is impossible in GA4 at any tier.
Published:
September 21, 2026



Get started today
Start driving better business outcomes with your customer data in less than a week
Book a demo
Explore use cases with an expert and see RudderStack in action.
Implement RudderStack
Start collecting and enabling real-time customer data everywhere it's needed.
Drive better outcomes
Supercharge your analytics, product, growth, and AI teams.