Blog
Churn Prediction With BigQueryML to Increase Mobile Game Revenue
Churn Prediction With BigQueryML to Increase Mobile Game Revenue

Benji Walvoord
Director of Solutions Engineering
6 min read
August 2, 2021

Powering Google BigQuery ML with RudderStack
One of my favorite parts about working at RudderStack is having the opportunity to speak with our customers and hear how they’re using the data collected via the RudderStack application to improve their bottom line. Yes, improving customer engagement through better personalization is the goal of all of our customers, but at the end of the day those efforts need to impact the bottom line.
I recently had the opportunity to speak with the team at Torpedo Labs about how they increased daily revenue by 10% for Wynn Casino’s Wynn Slots by reducing customer churn. Here’s how they did it.
Phase 1 - Powerful Dashboards To Define Engagement
You may recall a blog post in 2020 where we discussed how Torpedo was leveraging the RudderStack Unity SDK to send over 1 billion events per month to Redshift to power a robust analytics dashboard built with SuperSet. This cost-effective solution shed light on what player activities were important for driving engagement and helped refine the definition of high-value player cohorts as well as identify player churn. After crossing the 100 million download milestone, the teams at Wynn Resorts and Torpedo were looking for innovative ways to continue improving the gaming experience, user engagement and most importantly, reduce the churn on those high-value customers making in-app purchases.
Phase 2 - Churn Prediction Models Using BigQuery ML
In early 2021, the Data teams from Torpedo and RudderStack got together to discuss options for leveraging the data on their high-value players - the 5% of their customers who are responsible for 95% of their revenue. The idea proposed was to concurrently send the data being collected on certain cohorts of players to Redshift and BigQuery and leverage the power of Google BigQuery ML to create a churn prediction score for each user.
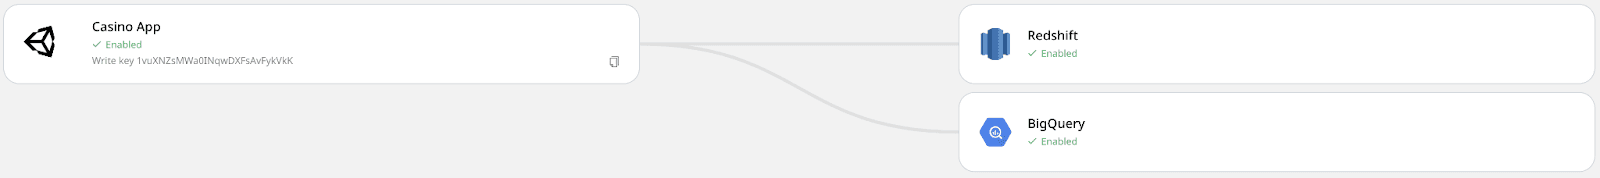
But before they could unleash the power of machine learning, the data needed to be loaded into Google BigQuery and Redshift, a simple task that was handled by connecting a second destination on the existing Unity SDK source within RudderStack.
Note: All the events routed by RudderStack are stored in a single track table in BigQuery with the entire JSON payload as a column.RudderStack also creates separate tables for each event type with the event properties as columns. This means:
- You can have access to the presence of an event (in the tracks table) or the entire event and its properties if you need more granular detail, exploiting BigQuery’s excellent support for semi-structured data.
- You can optimize the usage of BigQuery by partitioning the data based on the event time allowing you to optimize both the query execution time and the cost.
With the data loaded into BigQuery, the process of building, training, and testing the model could begin. For Torpedo & Wynn, the definition of player churn was already clearly defined so the first step in building the model was defining the inputs or player features that might indicate a likelihood for a player to churn. These features included events like purchasing coins, playing games, and winning jackpots, each of which corresponded to a different track call and table stored within BigQuery.
Understanding which player features contribute to player churn is both art and science, and it requires a solid understanding of the business and customer base. Our goal here is to highlight how RudderStack supports aggregating your event data by the user. For example, to determine when a player becomes a paying customer, RudderStack looked for their first ‘purchase’ event within the track table:
JSX
RudderStack identified other player features by aggregating data from within the individual track tables such as total number of spins and total earnings. This enabled RudderStack to create a unified player data set by joining each of the player features tables with the RudderStack anonymous id.
The combined tbl_player_reg data set also included other tabulated fields such as how long the player had been active, whether the player was considered high value and whether or not the player had churned. In addition, a player_pool value was randomly assigned to split the players into two distinct buckets, one used for training the model and the other for testing. To ensure this process is repeatable and not overly weighted, the player_pool flags for testing and training were allocated based on a ratio of the total number of players and their events.
JSX
The above query created a Logistic Regression model using the data from our combined player features table. Class weights were auto-assigned by the model. The training process was directed not to split the data into training and test datasets since this was set in the table itself and applied in the where clause. The name of the label column “churn” was also specified and flagged as true or false, depending on whether the user is churn-positive or churn-negative. The maximum number of training iterations or steps was also specified.
To evaluate the performance of the model, we ran the SQL outlined below against the ‘test’ player pool.
JSX
To predict the churn of our high-value players, the same player feature set table will be filtered for high_value equals true.
JSX
The output of the prediction model is a player rating from 0 to 1 with values of .5 or higher indicating a likelihood of a player churning. A JSON results file is then imported back into the application itself to generate push notifications and emails with incentives and offers to persuade players to re-engage with the app.
The player ratings make it easy for the team at Torpedo labs to identify which of Wynn Casino’s highest value customers are dangerously close to churning, and their re-engagement efforts are generating 10% increases in daily revenue. Innovative use cases like this are what get us excited here at RudderStack, and this RudderStack - BigQuery combination is just one example of how you can leverage RudderStack to fuel your machine learning applications.
Sign up for free and start sending data
Test out our event stream, ELT, and reverse-ETL pipelines. Use our HTTP source to send data in less than 5 minutes, or install one of our 12 SDKs in your website or app. Get started.
Published:
August 2, 2021


Get started today
Start driving better business outcomes with your customer data in less than a week
Book a demo
Explore use cases with an expert and see RudderStack in action.
Implement RudderStack
Start collecting and enabling real-time customer data everywhere it's needed.
Drive better outcomes
Supercharge your analytics, product, growth, and AI teams.