Blog
From First-Touch to Multi-Touch Attribution With RudderStack, Dbt, and SageMaker
From First-Touch to Multi-Touch Attribution With RudderStack, Dbt, and SageMaker

Dileep Patchigolla
Principal Data Scientist

Benji Walvoord
Director of Solutions Engineering
18 min read
March 1, 2022
An overview of the architecture, data and modeling you need to assess contribution to conversion in multi-touch customer journeys
Where should we spend more marketing budget?
The answer to this age-old budget allocation question boils down to determining which campaigns are working and which aren’t, but with the amount of data we collect on the customer journey today, it’s not always crystal clear which campaigns are which.
Upon first glance, it’s fairly straightforward to review metrics in ad platforms like Google ads to examine ROI on paid ad campaigns, and you may even be sending conversion data back to that platform, but you’re still restricted to evaluating only a fraction of the user interactions (one or two steps of the conversion path at best) that led up to and influenced a sale.
These limitations are due to the fact that many ad platforms were built when basic marketing attribution was enough for most companies. Today, though, data teams and marketers have more data than ever, increasing their appetite for more advanced attribution solutions. Even so, advanced attribution is still hard. But why?
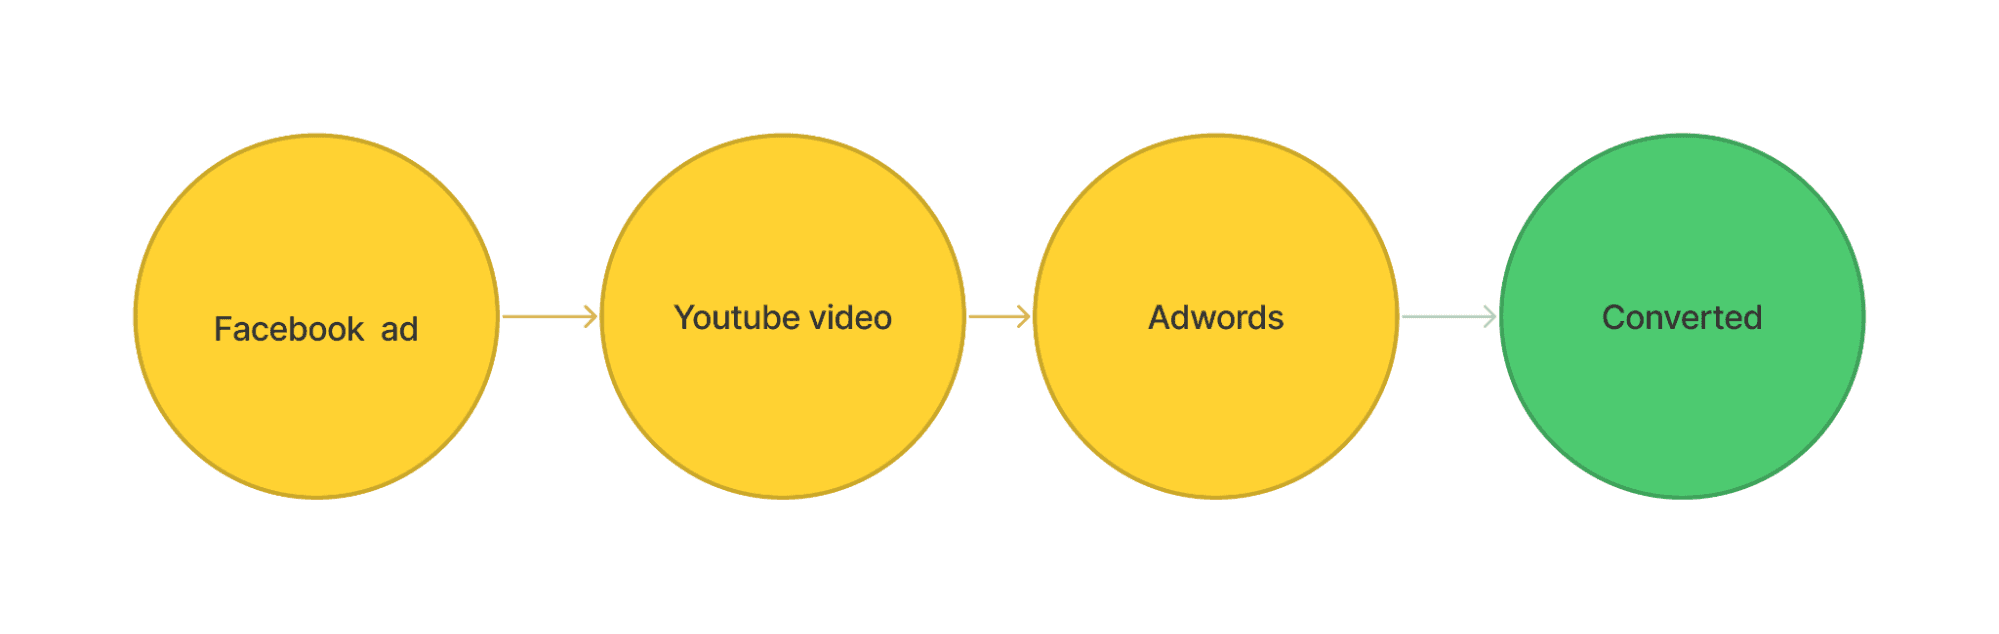
In short, moving beyond basic single-touch attribution introduces a number of complexities. Instead of binary outcomes (this digital marketing campaign brought someone to our site or it didn’t), a user can have many marketing touchpoints, which introduces the idea of influence along a buyer's journey, and that’s where things start to get tricky.
To understand which marketing efforts are contributing more to a successful objective (conversion event) we have to evaluate it relative to all of the other campaigns, and this is very complicated. First, it involves collecting and normalizing an enormous amount of data from a lot of different sources, and second it requires the application of statistical modeling techniques that are typically outside the skillsets of many marketing departments.
Neither of these marketing measurement challenges should be addressed by the marketing team. The first (comprehensive data collection) is a data engineering problem and the second (statistical modeling) is a data science problem. Because those are not core skills in marketing, most marketers fall back on last-touchpoint models or outsource complex attribution to third-party attribution tools that don’t have a complete picture of the attribution data. The problem is, these types of attribution cannot deliver the deep insights necessary for a holistic, cross-channel understanding of marketing performance across the whole consumer journey from the first touchpoint to the last click. Thankfully, modern tooling can solve this problem across teams.
The challenge: when a user is involved in multiple campaigns across multiple sessions on different devices, how do you know which of these different touchpoints actually influenced the sale?
The RudderStack approach involves building a data set in your warehouse that combines the events (user touches) as well as the metadata (such as the marketing campaign) associated with them. In addition to analyzing campaign performance, we can also use this same data for a variety of machine learning models including lead scoring and likelihood to repeat a purchase.
In this article we will walk through how we recently helped an e-commerce customer realign their marketing budget through the use of a combination of different attribution models. We will start with a high level architecture review and how they use RudderStack to collect all of the data (including marketing spend!) to create a complete story of the user journey in their own data warehouse. Next we will show you how they used dbt and RudderStack Reverse ETL to prepare the data for modeling. In this example AWS SageMaker was used to run the Jupyter Notebook and we will walk you through how the results of multiple models are sent back to their warehouse for reporting.
Architecture: from comprehensive data collection to using multi-touch attribution models
Here is the basic end-to-end flow:
- Stream behavioral events from various platforms (web, mobile, etc.) into the warehouse
- ETL additional data sets to complete the user journey data set in the warehouse (sales emails, app volume usage, inventory, etc.)
- Create enriched user journeys via RudderStack identity stitching
- Define conversion and user features using dbt
- Reverse-ETL user features to S3
- Run python models on the S3 data from a Jupyter Notebook in SageMaker and output results back to S3
- Lambda function streams new result records from S3 to RudderStack and routes to the warehouse and downstream tools
The end result is that the enriched user journey data produces a data flow and feature set that can feed multiple different attribution models as outputs, from simple to more complex. This is important because downstream teams often need different views of attribution to answer different questions. On the simple end of the spectrum, knowing how people initially enter the journey, their first touch, is very helpful for understanding which channels drive initial interest, while a last-touch model shows which conversions finally turn visitors into users or customers.
The most important data, however, often lives in between first touch and last touch. In fact, even in our own research on the journey of RudderStack users, we commonly see 10+ total touch points before conversion. Understanding the touchpoints that happen after the first touch that influence the last touch can reveal really powerful insights for marketing and product teams, especially if those touchpoints cost money (in the form of paid campaigns).
Let’s dig into an overview of the workflow for this use case. Here’s what we'll cover:
- A quick explanation of how data engineers can collect every touchpoint from the stack (without the pain)
- An overview of how to build basic first touch and last touch attribution
- An explanation of why it’s valuable to apply additional statistical models for multi-touch attribution and an overview of how feature building in dbt fits into the architecture
The data engineering challenge: capturing every touchpoint
Capturing the entire “user journey” is such a common use case, both for us and our customers, that our teams often take the term for granted. When we talk about user journeys, what we really mean is, “in chronological order, tell me every single touchpoint where a particular user was exposed to our business, whether that be on our website, mobile app, email, etc. and also include metadata such as UTM params, referring URLs etc. that might also provide context or insight about how that particular touchpoint.”
But where does all of that data come from? The answer is that it comes from all over your stack, which explains why it’s a data engineering challenge. For behavioral event data, our customer uses RudderStack Event Stream SDKs to capture a raw data feed of how users are interacting with their website and mobile app (we have 16 SDKs, from JavaScript to mobile and server-side and even gaming frameworks).
Behavioral data is only one piece of the puzzle, though. This customer also captured touchpoints from cloud apps in their stack. For that they leverage Rudderstack ETL sources to ingest application data from their CRM and marketing automation tools. Lastly, they use RudderStack’s HTTP and Webhook sources for ingesting data from proprietary internal systems (those sources accept data from anything that will send a payload).
It’s worth noting that RudderStack’s SDKs handle identity resolution for anonymous and known users across devices and subdomains. This allowed our customer to use dbt to combine data from cloud apps, legacy data and user event data as part of their identity stitching framework to achieve the coveted 360 view of the customer.
Capture every touchpoint with RudderStack
Test drive RudderStack today to see how uniform schema design and identity stitching can make your life easier.
Solving the data engineering challenge is really powerful stuff when it comes to attribution, in large part because data is the entire foundation of good modeling. This is also why we believe in building your customer data stack in the warehouse, where you are collecting all of your data anyways.
Our customer told us that one major advantage of having a flexible stack is that, unlike traditional first touch and last touch analysis in GA or Adobe Analytics, building a solution on the warehouse allowed them to factor in the effect (and cost) of coupons and other discounts applied at checkout (via server-side events) and treat them as alternative forms of paid marketing spend. Additionally, having data from sales and marketing automation tools truly completed the picture for them because they could evaluate the contribution of “offline” activity such as emails opened, even if the recipient didn’t click on any links that directed them back to the website. Both of these use cases were impossible for them with third party analytics tools and siloed data.
So at this point, our customer had all of the data in their warehouse and had stitched together customer profiles and journeys using dbt. Then what?
After building user journeys with RudderStack and dbt, they had the foundation for creating robust data models for statistical analysis and ML modeling. For their particular e-commerce use case, we helped them create a model that combined both the touchpoints and the marketing campaigns associated with those touchpoints to create a multipurpose dataset for use in SageMaker. Here is a sampling of some of event types and sources used:
List of Channels & RudderStack Event Types
Paid Channel (Event Name) | RudderStack Event Type |
|---|---|
Google - Paid Display (site_visit) | Page |
Google - Paid Search (site_visit) | Page |
Email - Nurture Newsletter (email_opened) | ETL |
Email - Abandoned Cart (email_opened) | ETL |
Twitter - Post Organic (site_visit) | Page |
Facebook - Display Image Carousel (site_visit) | Page |
Email - Retargeting (email_opened) | ETL |
Braze - SMS Abandoned Cart (sms_sent) | Track |
TikTok - Display (site_visit) | Page |
Youtube - Video (site_visit) | Page |
In App Messaging - Coupon Offer (coupon_applied) | Server-Side Track |
Instagram - Shopping (offline_purchase) | Existing Data In Warehouse |
Google - Shopping (site_visit) | Page |
Once we had established the touchpoints we needed in the dataset, the next step was defining the conversion—a key component of attribution models. This customer’s direct-to-consumer e-commerce use case defined conversion as a customer making any total purchases over a certain dollar threshold (many companies would consider these high value or loyal customers).
It’s important to note that this can comprise multiple purchases over any time period on a user level, which is impossible to derive in traditional analytics tools because it requires aggregating one or more transactions and one or more behavioral events and tying that to a known user. In the data warehouse, though, the customer had all of that data and could easily manage timelines because each touchpoint had a timestamp.
Using RudderStack and dbt, we helped them build a dbt model that output a single table of user touches with associated campaigns and flag each user with a timestamp of whether or not the user eventually converted. UTM parameters were extracted from Page calls and woven together with applicable track calls such as “Abandoned Cart Email Coupon Sent,” and then again combined with other data from ETL sources in the warehouse as outlined in the table below.
Row | name | type |
|---|---|---|
1 | USERID | VARCHAR(16777216) |
2 | EVENT_CATEGORY | VARCHAR(9) |
3 | EVENT | VARCHAR(16777216) |
4 | CHANNEL | VARCHAR(16777216) |
5 | TIMESTAMP | TIMESTAMP_LTZ(9) |
6 | CONVERSION_TIME | TIMESTAMP_LTZ(9) |
7 | ROW_ID | VARCHAR(16777216) |
The output table was designed to serve a variety of different statistical and ML models beyond this use case and includes the following columns:
- userId: RudderStack user identifier from the various events table. In our case we will use the Rudder ID created from the identity stitching model. For B2B applications, this could be AccountID, Org_ID, etc.
- event_category: The type of event being sourced. Not used in this analysis but may be useful for filtering or other ML modeling.
- event: The name of the specific event used to generate the touch. Again, this field is not used in our attribution modeling but will be used in other models.
- channel: The marketing channel attributed to this particular event. As we will see in our dbt, this could be driven by a UTM parameter on a page event or it may be extrapolated from the source itself (ie, braze SMS messages, email opens form customer.io, server-side events or shipping data already in the warehouse).
- timestamp: This will typically be the timestamp value on the event itself but could be any timestamp to indicate when this particular touch occurred
- conversion_time: This represents the timestamp of when the user had their first qualifying order total. This is computed in a different step within the dbt and applied to all of the events for that particular userId. If the user has not completed the checkout process, this will be null. It is important to note that we do not want any events for a particular user after the time the user converts.
- row_id: The sequence identifier for each userId. This is used by the RudderStack reverse etl to support daily incremental loads for new events each day.
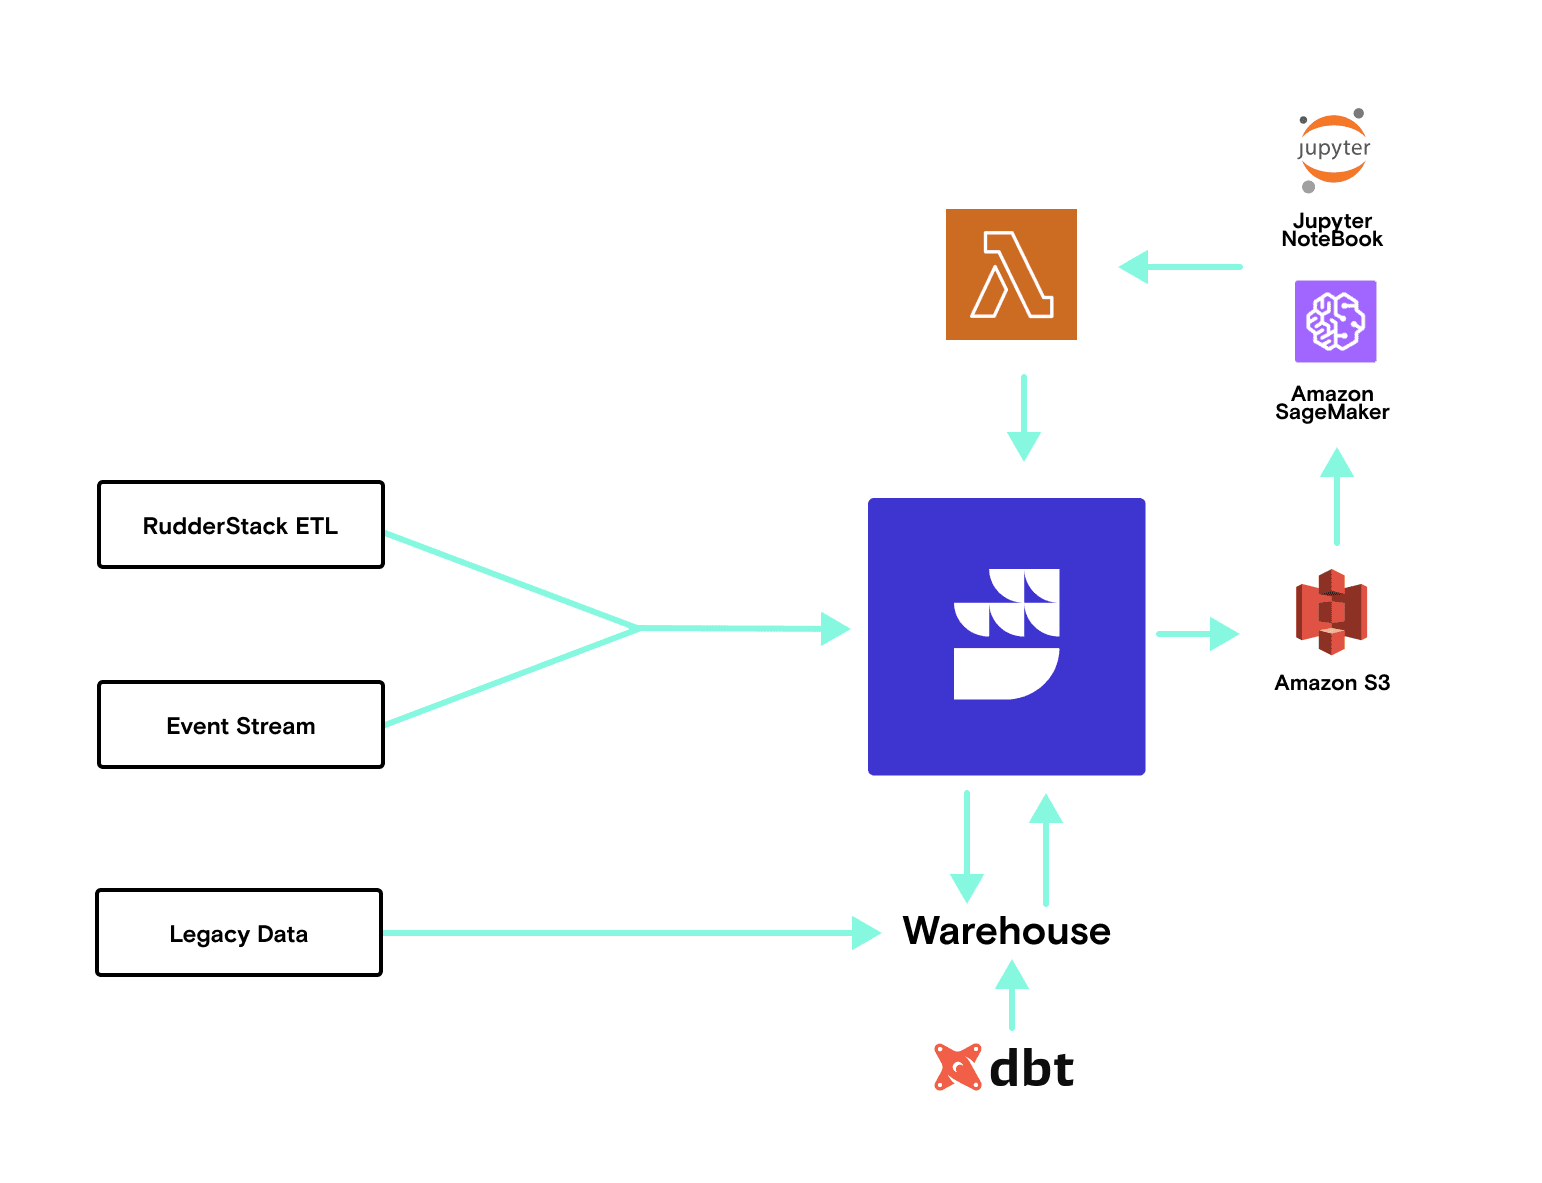
With the data set created in the warehouse, the customer connected RudderStack’s Reverse-ETL pipeline to send the table to S3, where the attribution modeling was executed in SageMaker and Jupyter Notebooks. They then used a Lambda function to send the results back through RudderStack and into the warehouse, where the team could begin interpreting results. (Keep your eyes peeled for a deep dive into that workflow in an upcoming post.)
Here’s a visual diagram of the architecture:
Starting with first and last touch attribution
As we said above, this customer wanted to evaluate various attribution models to answer different questions about their marketing spend and the customer journey.
They started simple, with basic first touch and last touch models. As we said above, every touchpoint is timestamped, so it was fairly simple to extract first/last touch and first/last campaign attribution. This customer in particular was interested in comparing that attribution across first and last touch models, which was simple to achieve within the same report, SQL query, etc. Interestingly, they said this was incredibly valuable because a similar comparative analysis couldn’t be performed in Google Analytics or using a spreadsheet to export last touch attribution from a CRM.
The problem with last touch attribution
Last touch attribution is the most common way to assign credit for conversion. As simple as it sounds, this is often the case because it’s the easiest kind of attribution to track, especially in tools that were never designed for attribution (custom fields in Salesforce, anyone?). For the sake of clarity, a last touch attribution model assigns all of the ‘credit’ to the last touch. So, if a conversion is valued at $x, and the user interacted with four different campaigns before conversion, only the final campaign gets the whole credit of $x while the 3 previous campaigns get zero credit.
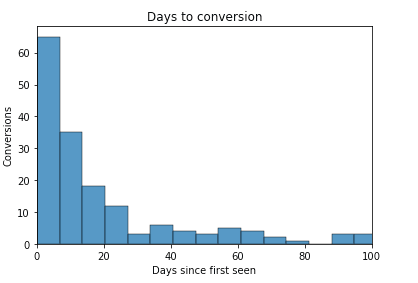
This becomes a major problem when the campaigns’ goals are different. For example, some campaigns may aim for brand awareness, which almost always means lower conversion rates. When brand campaigns do convert, it usually happens over a much longer period of time, even after the campaign has ended, or as an ‘assist’ that brings the user back in prior to conversion. So, even if certain brand campaigns are extremely influential on eventual conversion, last touch attribution models don’t afford them the credit they deserve. This is particularly important when marketing teams are trying to optimize the balance between spend on brand campaigns vs conversion campaigns.
We see this scenario across all of our customers, be they B2B or B2C, and the larger the sale, typically the flatter the tail. The chart below shows a typical Days to Conversion chart and highlights how last touch can grossly overstate the influence of a last touch campaign’s significance.
Better options through statistical modeling
With the complexity of today’s marketing environments and the limitations of last touch modeling, we must consider more complex alternatives for assigning the appropriate credit to the appropriate campaign and consider the full path up to the point of conversion—which is exactly what our customer set out to do.
This problem of attributing user conversion to all touches throughout the journey is called Multi-Touch Attribution (MTA). This itself can again be done in various rule-based approaches. Some examples of these rules are:
- Linear Attribution Model: This approach gives equal credit to all touches.
- Time-Decay Model: More recent touches are weighted more and the longer ago a touch occurred, the less weight it receives.
- U-Shape Attribution: Similar to Time-Decay except the first and last touches get higher credit and intermediate touches get less.
These are all heuristic based rules and can be arbitrary. At RudderStack we recommend a more data driven approach. We routinely employ these two established methods:
- Shapley values are derived from Game Theory, and they essentially capture the marginal contribution from each touch towards the ultimate conversion.
- Markov chain based values capture the probabilistic nature of user journeys, and the removal effect of each touch point. They also highlight the existing critical touches in the journey - points where if something goes wrong, the conversion probability is negatively impacted.
Here’s (Fig 3) how our results look using these three models:
Paid Channel (Event Name) | Last Touch | Markov | Shapley Values |
|---|---|---|---|
Google - Paid Display (site_visit) | 7.5% | 4.1% | 2.0% |
Google - Paid Search (site_visit) | 15.0% | 8.2% | 10.0% |
Email - Nurture Newsletter (email_opened) | 1.0% | 6.9% | 10.0% |
Email - Abandoned Cart (email_opened) | 20.0% | 9.1% | 15.0% |
Twitter - Post Organic (site_visit) | 2.5% | 11.3% | 3.0% |
Facebook - Display Image Carousel (site_visit) | 4.0% | 4.8% | 10.0% |
Email - Retargeting (email_opened) | 7.0% | 8.2% | 3.1% |
Braze - SMS Abandoned Cart (sms_sent) | 7.5% | 4.6% | 10.0% |
TikTok - Display (site_visit) | 5.0% | 8.8% | 7.3% |
Youtube - Video (site_visit) | 7.5% | 7.5% | 9.8% |
In App Messaging - Coupon Offer (coupon_applied) | 12.0% | 13.0% | 8.7% |
Instagram - Shopping (offline_purchase) | 1.0% | 4.3% | 10.0% |
Google - Shopping (site_visit) | 10.0% | 9.2% | 1.2% |
Total | 100% | 100% | 100% |
Helpful insights in comparing models
When our customer evaluated the returned results in their warehouse, they uncovered some pretty interesting and helpful insights:
- Last touch based attribution gives a very high weight to abandoned cart emails. Anecdotally this makes sense as users are likely enticed by a coupon for something they’ve already considered purchasing and this is the last activity they engage with prior to purchasing. On the other hand, both the Markov and Shapley values suggest that while this may occur just before a conversion, its marginal contribution is not as significant as the last touch model would suggest (remember, the key conversion is total purchases above some value). Instead of continuing to invest in complex abandoned cart follow-up email flows, the customer focused on A/B testing abandoned cart email messaging as well as testing recommendations for related products.
- In the last touch model, Instagram purchases don’t look like a compelling touchpoint. This alone was valuable data, because Instagram purchase data is siloed and connecting activity across marketplaces is complicated. Again, using the warehouse helped break those silos down for our customer. Interestingly, even though last touch contribution was very low, it was clear from the Shapely values that Instagram purchases were a major influence on the journey for high value customers. So, in what would have previously been a counter-intuitive decision, the customer increased marketing spend to drive purchases on Instagram and included content that drove customers back to their primary eCommerce site.
- Markov values for Twitter (organic) posts are much higher compared to the Shapley values. This showed our customer that not many people actually make a significant purchase based on Twitter posts, but when they do, they have very high intent. The customer reallocated spend from Google, which was overrated in the last touch model, and invested in promoting organic Twitter posts and creating new kinds of organic content.
- The Facebook Display campaign has a high Shapley value but low Markov value, which indicates a high dropoff rate from people after seeing ads on Facebook. Based on this insight, the customer moved budget from Facebook to TikTok and YouTube, both of which had far less dropoff.
Conclusion
The only way to truly understand what campaigns are working is to have full insight into every touchpoint of a user’s journey. RudderStack eliminates the engineering headaches involved in collecting and unifying all of your data feeds and reduces the build time for your data scientists with its uniform schema design and identity stitching. If you would like to learn more about how RudderStack can help address your company’s engineering or data science needs, sign up free today and join us on slack.
Published:
March 1, 2022


Get started today
Start driving better business outcomes with your customer data in less than a week
Book a demo
Explore use cases with an expert and see RudderStack in action.
Implement RudderStack
Start collecting and enabling real-time customer data everywhere it's needed.
Drive better outcomes
Supercharge your analytics, product, growth, and AI teams.