Blog
Feature Launch: Health Dashboard for data quality monitoring and alerting
Feature Launch: Health Dashboard for data quality monitoring and alerting

Mackenzie Hastings
Technical Product Marketing
5 min read
February 1, 2024

Managing customer data quality across numerous sources and destinations isn’t easy. Tracking plans help you catch errant data but don’t provide a holistic view of system health. As you manage increasingly complex infrastructure, you need a central place to track trends in data volume and violations. You’ll also want to configure thresholds for key alerts across your stack.
Our Data Quality Toolkit helps you ensure quality customer data from the source so you can spend less time wrangling and more time helping your business drive revenue. It simplifies creating shared data definitions, managing violations, and fixing bad data.
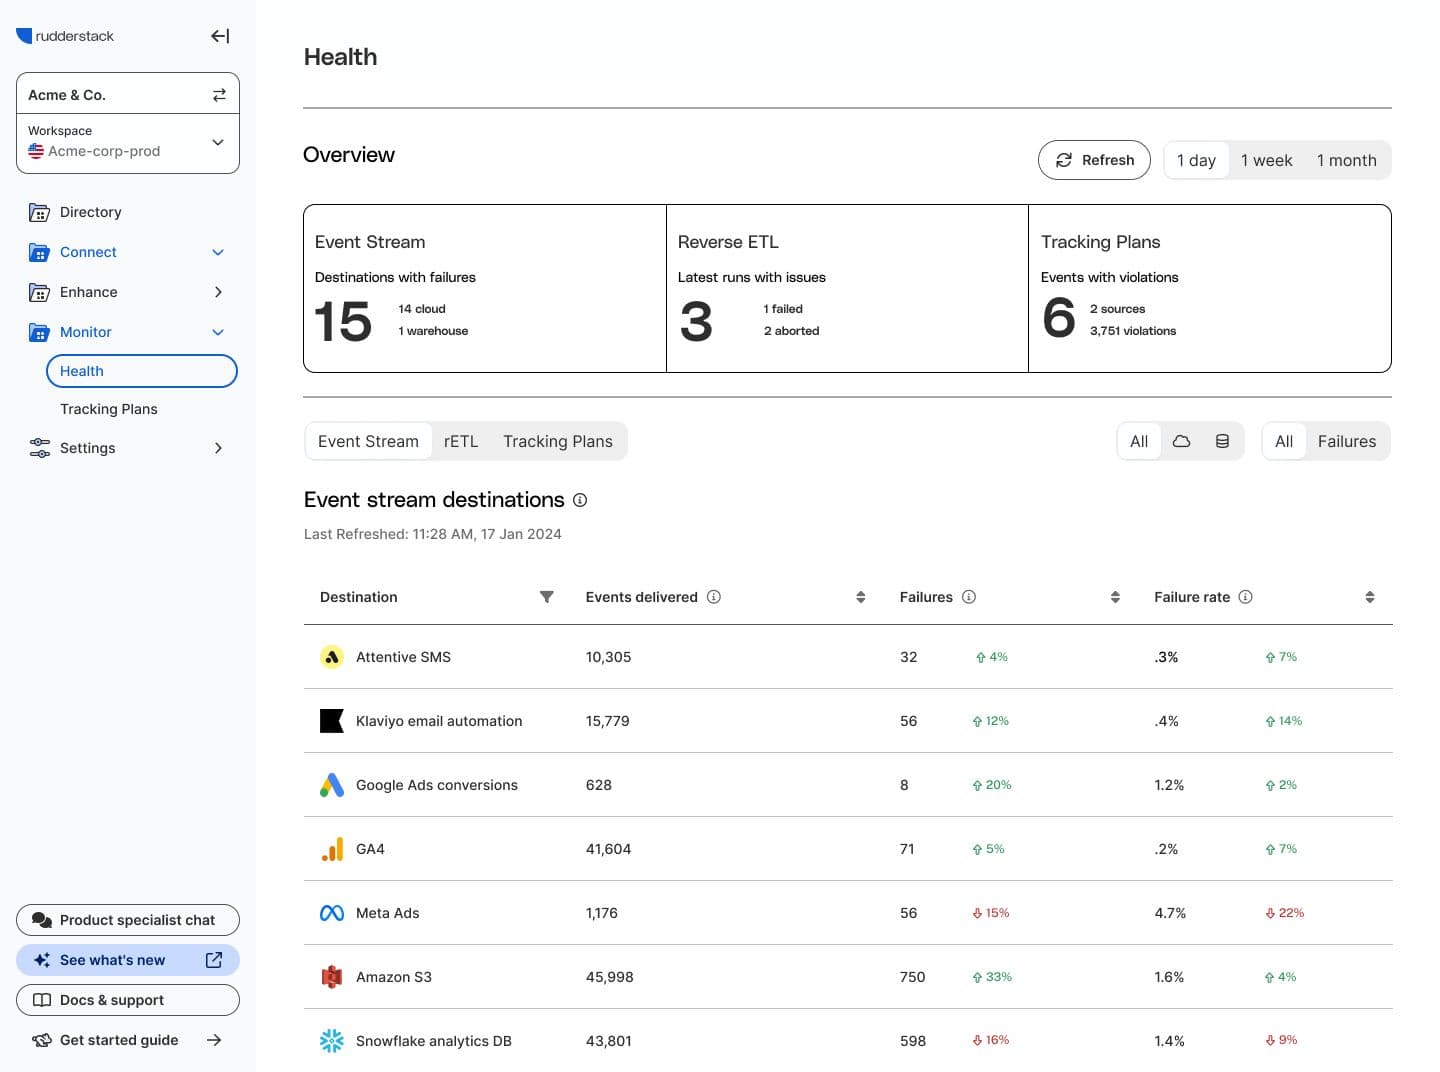
Today, we’re introducing our Health Dashboard, the final tool in the toolkit. It provides a centralized place to monitor data quality and manage alerts across your entire stack. With the Health Dashboard, you can foster data trust and ensure that every strategic decision—from marketing campaigns to product development—is based on accurate and reliable information.
Stay ahead of your data with the Health Dashboard and configurable alerts
Our Health Dashboard gives you a global view of your event data health. It exposes all the metrics you need to have confidence in your data infrastructure:
- Event ingestion metrics
- Event delivery metrics
- Warehouse load metrics
- Tracking plan violations
If you’re working with a complex stack and have no centralized place to assess system health, it's a game-changer. It empowers you to identify and address issues proactively.
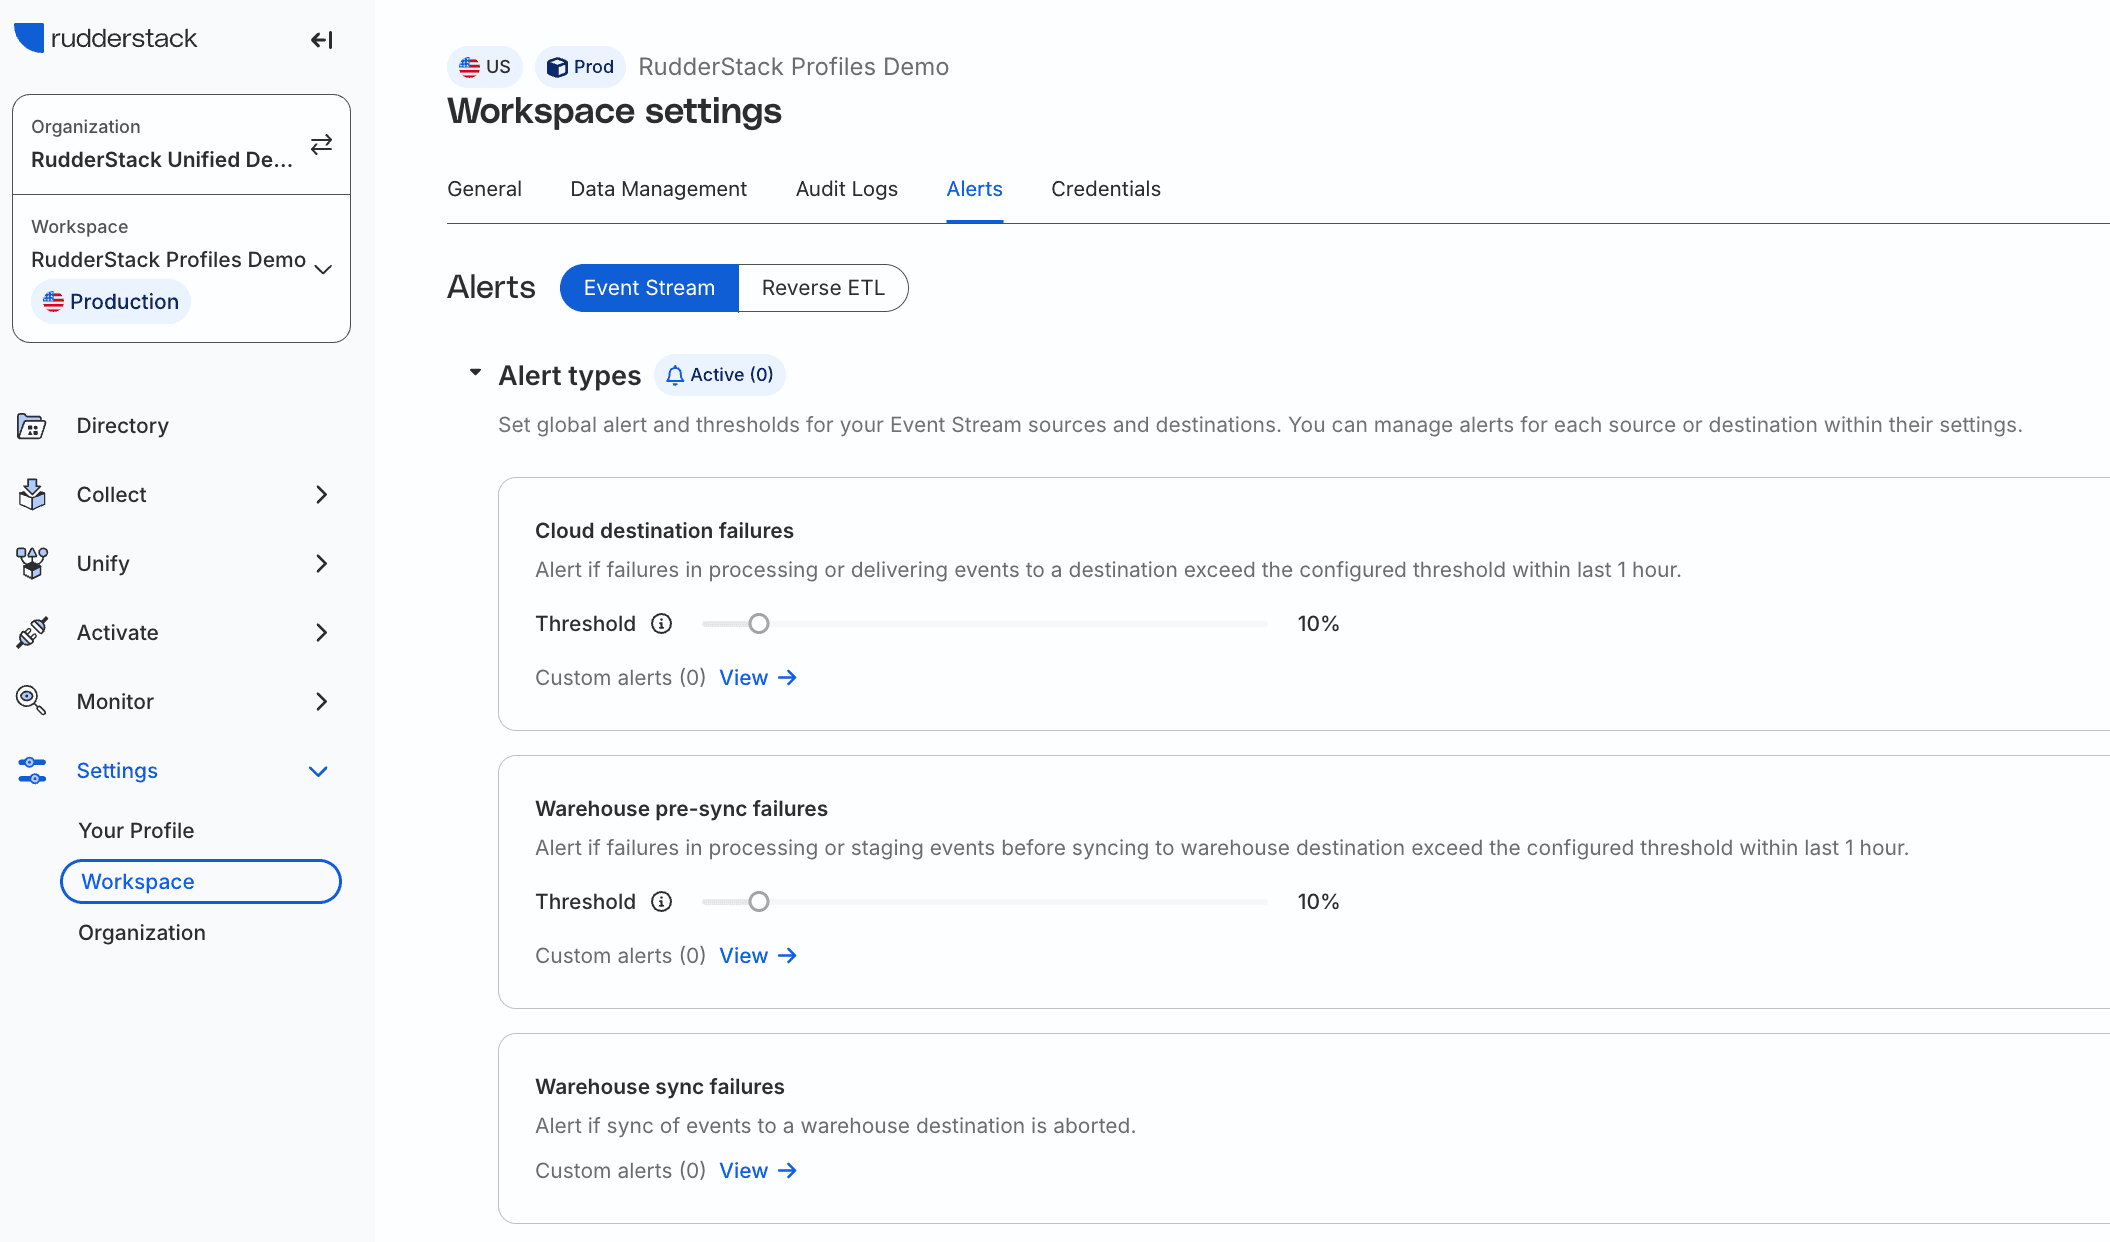
Our Health Dashboard doesn’t just offer visibility. Its alerting capabilities enable you to set up timely notifications for critical issues, allowing you to take immediate action. You can configure thresholds for key alerts by source and destination. Best of all, you can break alerting silos and deliver alerts to your preferred system via webhook. Whether you prefer Slack, PagerDuty, OpsGenie, or another tool, RudderStack makes it easy.
Through proactive monitoring and smart alerting, our Health Dashboard inspires confidence and enables you to address critical data issues before they escalate.
Practical tips for an effective response system
With proper monitoring and alerting, you can focus without worrying about "what-ifs." It’s easier to maintain your flow state when you trust that you’ll receive the right alerts at the right time and know you have the tools you need to fix issues quickly. Setting thresholds by source is a crucial piece of this puzzle. Here’s why it’s so important:
- Variability in source reliability – Not all data sources are created equal. Some are rock-solid, but others are less consistent. By tailoring thresholds to each source's reliability, you can ensure that your monitoring efforts match the risk involved.
- Data volume and sensitivity – High-volume or particularly sensitive data sources may demand more stringent monitoring.
- Error rate variance – Error rates can vary significantly across your sources. A one-size-fits-all threshold may either inundate your team with false alarms from a naturally noisy source or cause them to miss critical issues in a typically stable source.
- Operational priorities – Aligning thresholds with your operational priorities is crucial. Critical sources for business operations or decision-making need closer surveillance than less impactful ones. A strategic approach to alerting enables you to optimize resource allocation, ensuring you focus efforts where they are most needed.
When you customize your alerting strategies for each source, you can create a more nuanced and effective response system. This ensures that urgent issues get immediate attention, while less critical matters are appropriately triaged.
Here are a few types of alerts you can leverage to create an effective response system:
- Datatype Mismatch Errors – (Message Type Missing, Event Name Required)
- Delivery Errors – (Message Format, Invalid Payload)
- Delivery Warnings – (Column Limit, Warehouse Columns)
Interactive demo: Health Dashboard
Check out the interactive demo below to see the Health Dashboard in action:
Get started
Enforcing data quality across your entire stack is a challenge. Without a centralized place to monitor your data infrastructure and manage alerts, quality can get away from you. You can lose trust in your data, and if the data team doesn’t trust the data, nobody trusts the data.
Our Health Dashboard, complete with robust alerting capabilities, drives confidence. The Health Dashboard gives you a global view of system health. Alerting capabilities enable you to build an effective response system so you can spend less time worrying about data quality and more time helping your business drive revenue.
To learn more about the Health Dashboard, check out the docs. To see the feature in action alongside the rest of our Data Quality toolkit, request a demo with our team or sign up for our webinar featuring data quality expert Chad Sanderson on guaranteeing quality customer data from the source.
Watch the data quality webinar
Watch our session with special guest Chad Sanderson to get expert guidance on data quality and learn how to guarantee quality customer data from the source
Published:
February 1, 2024


Get started today
Start driving better business outcomes with your customer data in less than a week
Book a demo
Explore use cases with an expert and see RudderStack in action.
Implement RudderStack
Start collecting and enabling real-time customer data everywhere it's needed.
Drive better outcomes
Supercharge your analytics, product, growth, and AI teams.