Blog
Lessons from scaling PostgreSQL queues to 100k events per second
Lessons from scaling PostgreSQL queues to 100k events per second

Aris Tzoumas
Staff Software Engineer
20 min read
July 14, 2025

At RudderStack, we decided to use PostgreSQL as our main streaming engine and queuing system instead of specialized tools like Apache Kafka. We picked PostgreSQL because it's flexible, reliable for transactions, and easier to debug. If you are curious to learn more about that decision, read the previous post about the rationale behind why we chose Postgres over Apache Kafka and the initial architectural patterns we employed. Over the past six years, this system has proven reliable and has scaled to handle 100,000 events per second—but only after we successfully navigated challenges like table bloat, query performance degradation, index bottlenecks, and retry storms.
This post is a chronicle of the critical, hard-won lessons learned while maturing PostgreSQL into a highly performant and resilient queuing system.
Before we dive in, let’s briefly recap on how our job queues are structured using PostgreSQL.
A quick primer on our queues
We use multiple queues, each tailored to a specific purpose, but they all share a common internal architecture. At the core of each queue is one or more ordered datasets, and each dataset typically contains around 100,000 jobs.
For each dataset, we maintain two core tables:
- Jobs Table: This table stores the actual event payloads along with all the metadata required for processing each job. Think of it as the source of truth for what needs to be done.
- Job Status Table: This acts as an append-only log that tracks the lifecycle of each job. Whether a job is processed successfully, fails, or is aborted, a new entry is recorded here to reflect its current status.
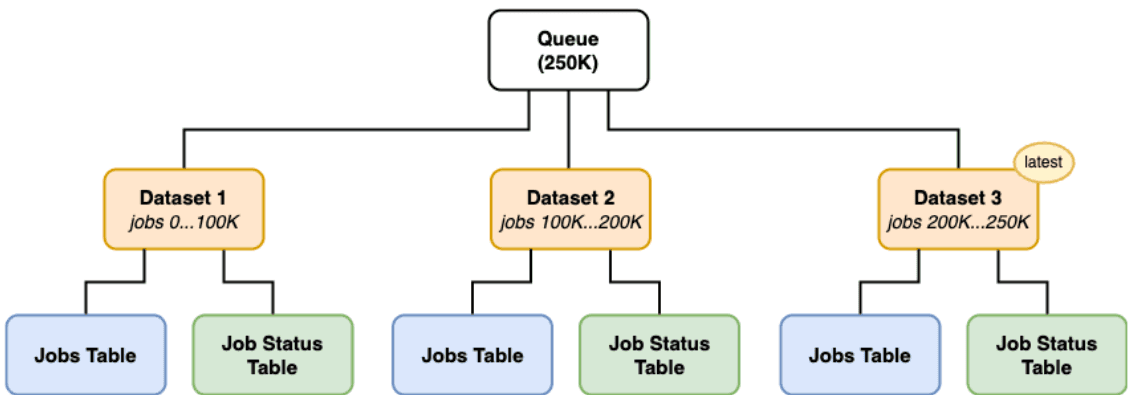
We chose to partition our queues into multiple datasets capped at 100,000 rows each to ensure faster index scans and avoid the performance degradation that occurs as PostgreSQL table sizes grow.
The indispensable role of indexing
In the early stages, our queue tables had minimal indexes beyond primary keys. This approach, while facilitating rapid initial development, soon encountered the inevitable friction of scale. As the volume of jobs flowing through our platform increased, queries responsible for fetching pending jobs began to exhibit noticeable slowdowns. This performance degradation was a clear signal that the default data retrieval mechanisms were becoming inefficient, pointing directly towards the need for a more sophisticated indexing strategy.
So, we identified the most frequent and performance-sensitive query patterns. These patterns typically involved looking up jobs based on specific attributes depending on the data pipeline:
- For our ingestion processing pipelines, queries are targeting jobs for a particular source id
- For our destination delivery pipelines, queries are targeting jobs for a particular destination id
- For our free customer pipelines, queries are targeting jobs across an entire customer's workspace id
EXPLAIN ANALYZE helped us design and implement targeted indexes. For instance, composite indexes such as INDEX ON status_table (job_id, id DESC, job_state) were introduced, tailored to the columns frequently used in WHERE clauses and ORDER BY conditions for each query pattern.
It is worth noting that we were very cautious while adding new indexes, as there's always a risk of introducing too many, which can hinder inserts and lead to database disk bloat. The impact of these strategic indexing efforts was profound. Query execution times for job retrieval dropped dramatically, and overall system throughput saw significant improvements.
Index-only scans & the loose index scan saga
Index-Only Scans (IOS) in PostgreSQL allows the database to satisfy a query entirely from an index, without needing to access the actual table data (the heap).
This avoidance of heap fetches significantly reduces I/O operations and can lead to substantially faster query execution, especially for queries that are executed frequently or involve a large number of rows.
However, consistently achieving Index-Only Scans is not always straightforward.
For IOS to work consistently, several conditions must be met:
- Column coverage: the query must select only columns that are part of the index
- Visibility verification: PostgreSQL must be able to verify the visibility of the rows using the visibility map (a data structure that tracks whether all tuples on a given data page are visible to all current and future transactions)
However, in write-heavy tables, such as those in a queuing system, frequent INSERTs can lead to a churn in the visibility map, reducing the likelihood of pages being marked all-visible and thus potentially forcing heap fetches even if an index technically covers the query. This dynamic nature means that the effectiveness of IOS can fluctuate, demanding regular maintenance (like VACUUM operations) to keep the visibility map up-to-date. But, more about VACUUM in a while.
One recurring challenge that we faced involved a query executed every second to identify active pipelines—sources, destinations, or workspaces that had pending jobs. This query essentially required a SELECT DISTINCT on pipeline identifier columns in our queue tables. The purpose was to determine which worker processes needed to be activated to process these jobs. The difficulty arose because queue tables often contain many jobs for the same pipeline, leading to numerous identical keys in the corresponding index. In such scenarios, a standard SELECT DISTINCT might not be as efficient as a loose index scan (also known as a skip scan), a technique where the database can efficiently jump from one distinct key to the next in an index without reading all intermediate identical keys.
Unfortunately, PostgreSQL does not natively support loose index scans. While plans for such features may exist, their absence necessitates workarounds for performance-critical use cases. To achieve the required performance for identifying active pipelines, we relied on a technique that uses recursive Common Table Expressions (CTEs), as documented in the PostgreSQL community wiki. For example, a query to find distinct values in a column col can be emulated using a recursive CTE like:
SQL
This structure, while more verbose and complex than a simple SELECT DISTINCT col FROM tbl, can be orders of magnitude faster when the number of distinct values is small relative to the total number of rows, a common characteristic in the active pipeline identification scenario.
Taming the beast: Status updates, retries, and table bloat
Our queuing system needs to keep track of job states. For each attempt to deliver a job, two entries are recorded in the dedicated job status table: one marking the job as "in progress" and another one capturing the final outcome of that attempt (e.g., success, terminal failure, or retryable error).
This design is important for insertion speed and, as a side-effect, the detailed logging can also be invaluable for observability & debugging. However, this design also presents a significant challenge in scenarios involving persistent retryable errors—a retry storm. Consider a situation with 100,000 jobs, all of which repeatedly fail due to a transient downstream issue. If each job is retried, say, 10 times, this would result in 100,000×10×2=2,000,000 rows being inserted into the job status table in the blink of an eye. This rapid accumulation of status entries can cause the table to grow enormously, a phenomenon often referred to as table bloat.
The problem with such unchecked growth is that the job status table is frequently queried. When the system attempts to pick up new jobs, it consults this table to ascertain the latest status of existing jobs, preventing redundant processing or respecting backoff periods. However, querying an index that is constantly growing, along with its underlying table, becomes progressively slower. This directly impacts the latency of the core queue processing loop, degrading the entire system's responsiveness.
To counteract this, we implemented a strategy of periodic compaction for the job status table. Compaction, in this context, involves deleting older status records directly from the table, ensuring only the latest status record for each unique job is retained. All older, intermediate status updates for a given job are removed.
A critical follow-up step after such a significant data purging operation is to execute VACUUM ANALYZE on the job status table. The VACUUM command helps reclaim storage space occupied by "dead tuples" resulting from the deletions. More importantly, ANALYZE collects fresh statistics about the data distribution within the table and its indexes. These statistics are vital for the PostgreSQL query planner to generate efficient execution plans for subsequent queries against the compacted table. Without up-to-date statistics, the planner might make suboptimal choices, diminishing the performance benefits gained from compaction.
The power of COPY
In a high-throughput queuing system, the efficiency of writing data, especially status updates and new job entries, is paramount. We discovered early on that the method of data insertion significantly impacts performance. While standard row-by-row INSERT statements are functionally correct, they carry a certain overhead for each row processed. For scenarios involving large batches of data, such as recording numerous job status updates simultaneously or ingesting a large number of new jobs, this overhead can accumulate and become a bottleneck.
To address this, we leverage PostgreSQL's COPY command for bulk data loading. The COPY command is specifically designed for loading large amounts of data into a table efficiently. Unlike individual INSERT statements, COPY bypasses much of the per-row processing overhead. It streams data directly into the table, often with less logging and fewer constraint checks per row (though overall transactional integrity is maintained). This results in substantially higher data ingestion rates.
Evolving compaction
Our initial approach to managing the growth of our queue’s datasets involved a relatively straightforward heuristic: compacting a dataset when a certain percentage of the jobs within it were completed. While this strategy aimed to keep datasets lean, it came with a significant operational drawback. The compaction process, which typically involves copying active data from the old dataset(s) to a new, smaller one, is resource-intensive. Critically, during this data copying phase, all other read and update operations on the affected queue need to be paused. For a system designed for continuous data flow, these pauses, however brief, were disruptive and could impact overall pipeline latency.
Our goal remained to keep the queues as lean as possible to maintain performance, but this had to be balanced against the need for high availability and minimal disruption. This led to an evolution in the compaction logic, moving from a brute-force, percentage-based trigger to a more selective and intelligent set of rules.
Two key strategies emerged from this refinement:
- Fast deletion for completed datasets: If all jobs within a particular dataset are processed and marked as completed, the entire dataset can be quickly removed. This operation, often translating to a DROP TABLE, is significantly faster than copying data and typically involves minimal locking, thus avoiding lengthy queue pauses.
- Conditional merging/compaction for active datasets: For datasets that still contain active (incomplete) jobs, the decision to compact (i.e. copy data to a new, consolidated dataset) became more nuanced. The revised logic dictates that such a compaction operation is performed only if it results in fewer active datasets than before. For example, if three consecutive datasets have, say, 30,000, 20,000 and 30,000 incomplete jobs respectively out of an original 100,000 each, they might be compacted into a new single dataset containing 80,000 active jobs. However, if only one dataset was to be compacted the compaction would be deferred.
Caching: The pill against growing pains
As our queues scale, the number of datasets can grow substantially. It's not uncommon for a mature queue to be composed of hundreds of such datasets. While compaction strategies help manage the size and count of these datasets, a large number of active datasets can still persist, especially during periods of high ingress or when processing long-running jobs.
This proliferation of datasets can negatively impact query performance, particularly when trying to locate specific jobs. Consider a scenario where a particular pipeline (a logical partition within the queue, perhaps defined by a source id or destination id) has only a few incomplete jobs, and these jobs happen to reside in the most recently created datasets, effectively at the "end" of the logical queue. To find these jobs, a query might naively have to iterate through or check hundreds of older datasets first, even if those older datasets contain no pending jobs for that specific pipeline. This leads to wasted I/O and increased query latency.
To mitigate this, we implemented several layers of caching, tailored to specific bottlenecks:
- The "No Jobs Cache": This is an application-level cache designed to short-circuit queries for pipelines in datasets where they have no active jobs. It maintains a record, indicating which (pipeline_id, dataset_id) combinations are known to have zero incomplete jobs. Before issuing a database query to a specific dataset for a given pipeline's jobs, the system first consults this cache. If the cache indicates that (pipeline_X, dataset_Y) has no incomplete jobs, the database query against dataset_Y for pipeline_X is skipped entirely. This simple yet effective mechanism can dramatically speed up job discovery by pruning the search space, avoiding unnecessary database access for segments known to be empty for the target pipeline.
- Active Pipelines Cache (Revisited): As mentioned earlier in the context of optimizing SELECT DISTINCT queries, we also employ a cache for the list of active pipelines. Even with optimized SQL using recursive CTEs to emulate loose index scans, repeatedly executing this query every second across a multitude of datasets can impose a significant and often redundant load on the database, especially when the set of active pipelines doesn't change frequently within that one-second interval. This cache stores the results of the "active pipelines" query for a short Time-To-Live (TTL). Subsequent requests for this list within the TTL are served from the cache, reducing database load and improving the responsiveness of the worker dispatching mechanism.
Can bytes be worse than strings in Go? An anomaly during data transfer
An interesting and somewhat counterintuitive observation made by our team related to how data types in Go map to PostgreSQL column types, specifically concerning data transfer volume over the network. It was found that writing a Go byte slice using the standard Go PostgreSQL driver (pq or pgx) resulted in approximately twice the amount of data being transferred compared to writing the same logical bytes represented as a Go string.
The root cause of this discrepancy lies in the default encoding behavior of Go PostgreSQL drivers when handling byte slices destined for the database. PostgreSQL's bytea type, for example, accepts binary data in two primary formats: "hex" which is the default and "escape". The hex format encodes each byte of binary data as two hexadecimal characters (e.g., \x27). The Go driver converts a byte slice into its hex string representation before sending it over the wire, this inherently doubles the size of the data: each input byte becomes two characters in the hex string.
This hex encoding behavior can occur even when the target column is text since the byte slice is treated as arbitrary binary data that needs a safe string representation. In contrast, when a Go string is provided, the driver sends the raw byte representation of that string (e.g., its UTF-8 bytes) directly, without an additional layer of hex encoding, resulting in a data transfer size roughly equivalent to the string's byte content.
The implications are significant for a high-throughput system like ours. A 2x inflation in data transfer for event payloads or other binary data translates to substantial overhead in network bandwidth and potentially CPU usage for encoding/decoding.
| Go Input Type | PG Column Type (Example) | Driver Behavior | Data Transfer Factor (Approx.) |
|---|---|---|---|
byte | bytea / text | Hex encodes byte to stringe | ~2x |
string | Before loading | Sends string's raw bytes (UTF-8) | ~1x |
Given this anomaly and the fact that our payloads can be effectively described and processed as strings, we opted to standardize on using Go strings. This decision directly mitigates the observed data transfer overhead, ensuring more efficient network utilization and overall system performance.
Decoding disk write throughput amplification
A key operational metric that we closely monitor is disk I/O. A notable observation was a consistent pattern of write amplification: for every 1 Megabyte per second (MB/s) of logical data the application intended to write to the queue, PostgreSQL was observed to be performing approximately 3 MB/s of actual physical disk writes. This phenomenon, where the amount of data written to the storage device exceeds the amount of data the application logically sends, is known as Write Amplification (WA).
Understanding the sources of this amplification within PostgreSQL is crucial for accurate capacity planning and performance tuning:
- Write-ahead logging (WAL): PostgreSQL, like most ACID-compliant relational databases, employs Write-Ahead Logging to ensure data durability and recoverability. Every data modification (INSERT, DELETE) is first recorded in a WAL file before the changes are applied to the actual data pages (heap tables or indexes). This fundamental mechanism means that, at a minimum, each logical write results in at least two physical writes: one to the WAL stream and another (often deferred) to the data file itself during a checkpoint or via the background writer process.
- Page-based writes and multi-version concurrency control (MVCC): PostgreSQL organizes data on disk in fixed-size blocks called pages, typically 8KB. Even a small modification to a single row might necessitate writing out the entire 8KB page to disk.
- TOAST (The Oversized Attribute Storage Technique): When column values exceed a certain threshold (around 2KB), PostgreSQL automatically employs TOAST to store them. Large values are broken down into smaller chunks and stored in a separate TOAST table, with the main table row containing only a pointer.
- Index maintenance: For every table that has indexes, any DML operation (INSERT, DELETE) requires corresponding modifications to all relevant indexes. Each index is a separate data structure on disk, and these updates also generate physical writes. A table with multiple indexes will see this write overhead multiplied. For a queuing table, which is typically indexed for various access patterns, this is a significant contributor to WA.
Whenever we are provisioning storage infrastructure (IOPS, throughput) and predicting system capacity, this amplification is being factored in (3x in our case) to avoid under-provisioning and performance surprises.
When memory is not enough, the rules of the game change
The performance characteristics of a database system are heavily influenced by how effectively it utilizes memory. In an ideal scenario, if the entire active working set of our queue—including frequently accessed job data, status information, and their corresponding indexes—can fit entirely within PostgreSQL's shared buffer cache (RAM), read operations are exceptionally fast. As noted from experience, when the data is memory-resident, physical disk reads can approach zero, and the system feels blazing fast.
However, the reality for any system designed to handle large and growing datasets is that the working set will eventually exceed the available physical memory. As the queue accumulates more jobs and as the number of "datasets" increases, the portion of data that can be kept hot in RAM diminishes. When PostgreSQL needs data that is not in its shared buffers, it must fetch the required data pages and index pages from disk.
This transition from memory-bound to disk-bound operations introduces new potential bottlenecks: disk read throughput and Input/Output Operations Per Second (IOPS). Disk I/O is inherently orders of magnitude slower than RAM access.
Recognizing this inevitable shift, we have adopted a proactive stance by explicitly measuring the performance of our queuing system against large queues—queues that are intentionally sized to ensure their working set exceeds available memory. This approach allows us to:
- Identify potential I/O bottlenecks before they manifest in production.
- Understand the system's performance characteristics and limits under disk-bound conditions.
- Make informed decisions regarding hardware provisioning (e.g., selecting appropriate storage tiers with sufficient IOPS and throughput), query optimization (to minimize disk access), and data management strategies (like compaction and caching, which help reduce the active working set or the need to access disk).
PostgreSQL settings that matter (to us)
Beyond application-level optimizations and schema design, the underlying PostgreSQL configuration plays a vital role in tailoring the database's behavior to specific workloads. We have iteratively tuned several key parameters to enhance the performance and resilience of our queuing system.
Here are some notable adjustments and their rationale:
| Parameter | Default Value | New Value | Purpose | Key Impact |
|---|---|---|---|---|
max_wal_size | 1GB | 2GB | Allow more WAL data before forcing checkpoints | Reduces checkpoint frequency, smooths write performance under heavy loads |
checkpoint_timeout 30s | 5 minutes | 30s | Flush data to disk more regularly | Faster crash recovery (less WAL to replay) |
work_mem | 4MB | 64MB | Memory for sort operations and hash tables | Frees memory for shared buffer cache, prevents heavy queries from consuming excessive memory |
hash_mem_multiplier | 2.0 | 4 | Allows hash tables to grow larger before spilling to disk | Improves hash joins and aggregations by keeping more data in memory |
maintenance_work_mem | 64MB | 200MB | Memory for VACUUM and CREATE INDEX operations | Significantly speeds up crucial maintenance operations (~5% of system memory) |
effective_cache_size | 4GB | 4GB | Hints to query planner about available cache memory | Helps planner make better decisions between index vs sequential scans |
wal_buffers | -1 (auto: 1/32 of shared_buffers, 64kB-16MB) | 64MB | Temporary storage for WAL records before disk flush | Improves write performance with concurrent transactions via larger, efficient chunks |
random_page_cost | 4.0 | 1.1 | Cost estimate for non-sequential disk page access | Makes planner favor index scans over sequential scans (optimized for SSDs) |
autovacuum_vacuum_cost_delay | 2ms | 1ms | Delay when autovacuum cost limit is hit | More responsive, aggressive autovacuuming in smaller, frequent bursts |
autovacuum_naptime | 1 minute | 20s | Frequency of autovacuum launcher checks | More frequent vacuuming, better table statistics, faster dead tuple cleanup |
checkpoint_warning | 30 s | 0 (disabled) | Controls checkpoint frequency warnings | Eliminate noise from frequent checkpoint warnings in heavy write systems |
Here’s the summary of the changes:
Focused on write performance:
- Larger WAL buffers and max WAL size for better write handling
- More frequent but shorter checkpoints for faster recovery
Focused on memory optimization:
- Reduced work_mem with increased hash multiplier for balanced memory usage
- Larger maintenance memory for faster VACUUM operations
Focused on query optimization:
- Lower random page cost assumes SSD storage
- Better cache size hints for smarter query planning
Focused on maintenance tuning:
- More aggressive autovacuum settings for busy queuing systems
- Disabled noisy checkpoint warnings
These configuration changes are not universal recommendations but reflect a tuning process specific to our workload, infrastructure, and performance objectives. Careful monitoring and iterative adjustments are key to finding the optimal settings for any PostgreSQL deployment.
Conclusion
The journey of leveraging PostgreSQL as a high-performance queuing system at RudderStack has been one of continuous learning and adaptation. It requires moving beyond basic operations to a deep understanding of its internal mechanics, query execution strategies, I/O behaviors, and configuration nuances.
Despite the complexities and challenges encountered, PostgreSQL has consistently demonstrated its power and flexibility, proving to be a robust and highly capable platform for our demanding queuing workloads. The path to optimization is rarely a one-time effort. As systems evolve, data volumes grow, and access patterns shift, new bottlenecks can emerge. Therefore, maintaining a high-performance queuing system, or any data-intensive application, requires a commitment to ongoing monitoring, analysis, and refinement.
Published:
July 14, 2025
More blog posts
Explore all blog posts
Event streaming: What it is, how it works, and why you should use it
Brooks Patterson
by Brooks Patterson

From product usage to sales pipeline: Building PQLs that actually convert
Soumyadeb Mitra
by Soumyadeb Mitra
RudderStack: The essential customer data infrastructure
Danika Rockett
by Danika Rockett


Start delivering business value faster
Implement RudderStack and start driving measurable business results in less than 90 days.