Blog
How We Reduced Startup Time by 80% With Webpack
How We Reduced Startup Time by 80% With Webpack

Aris Konstantoulas
Software Engineer, RudderStack
9 min read
April 21, 2022

One of the development models we use at RudderStack is to build securely and quickly then optimize later as needed. This mindset allows us to give top priority to customer issues while keeping up with RudderStack’s rapid growth.
But in some cases, this approach leads to the attrition of Developer Experience. When this happens, we refocus using the Pareto Principle and aiming to get the most bang out of the time we invest in removing tech debt.
An example of this not-so-good developer experience is when deployment times for Control Plane's primary backend service got excessively long. It used to take 5 minutes to deploy in production. More importantly, it took anywhere from 40-90 seconds, depending on hardware, to restart during development. This became a major pain point, slowing progress for our team, so we knew it was time to refocus and solve the problem. Here’s how we did it.
What is Control Plane?
First, I’ll explain what I mean by Control Plane. Rudderstack’s architecture is split into two parts: Data Plane and Control Plane. Control plane is the brain of the Rudderstack platform. It’s where resources and configurations are stored. User management & collaboration for your organization, workspaces, infrastructure, and billing, all take place in the Control Plane.
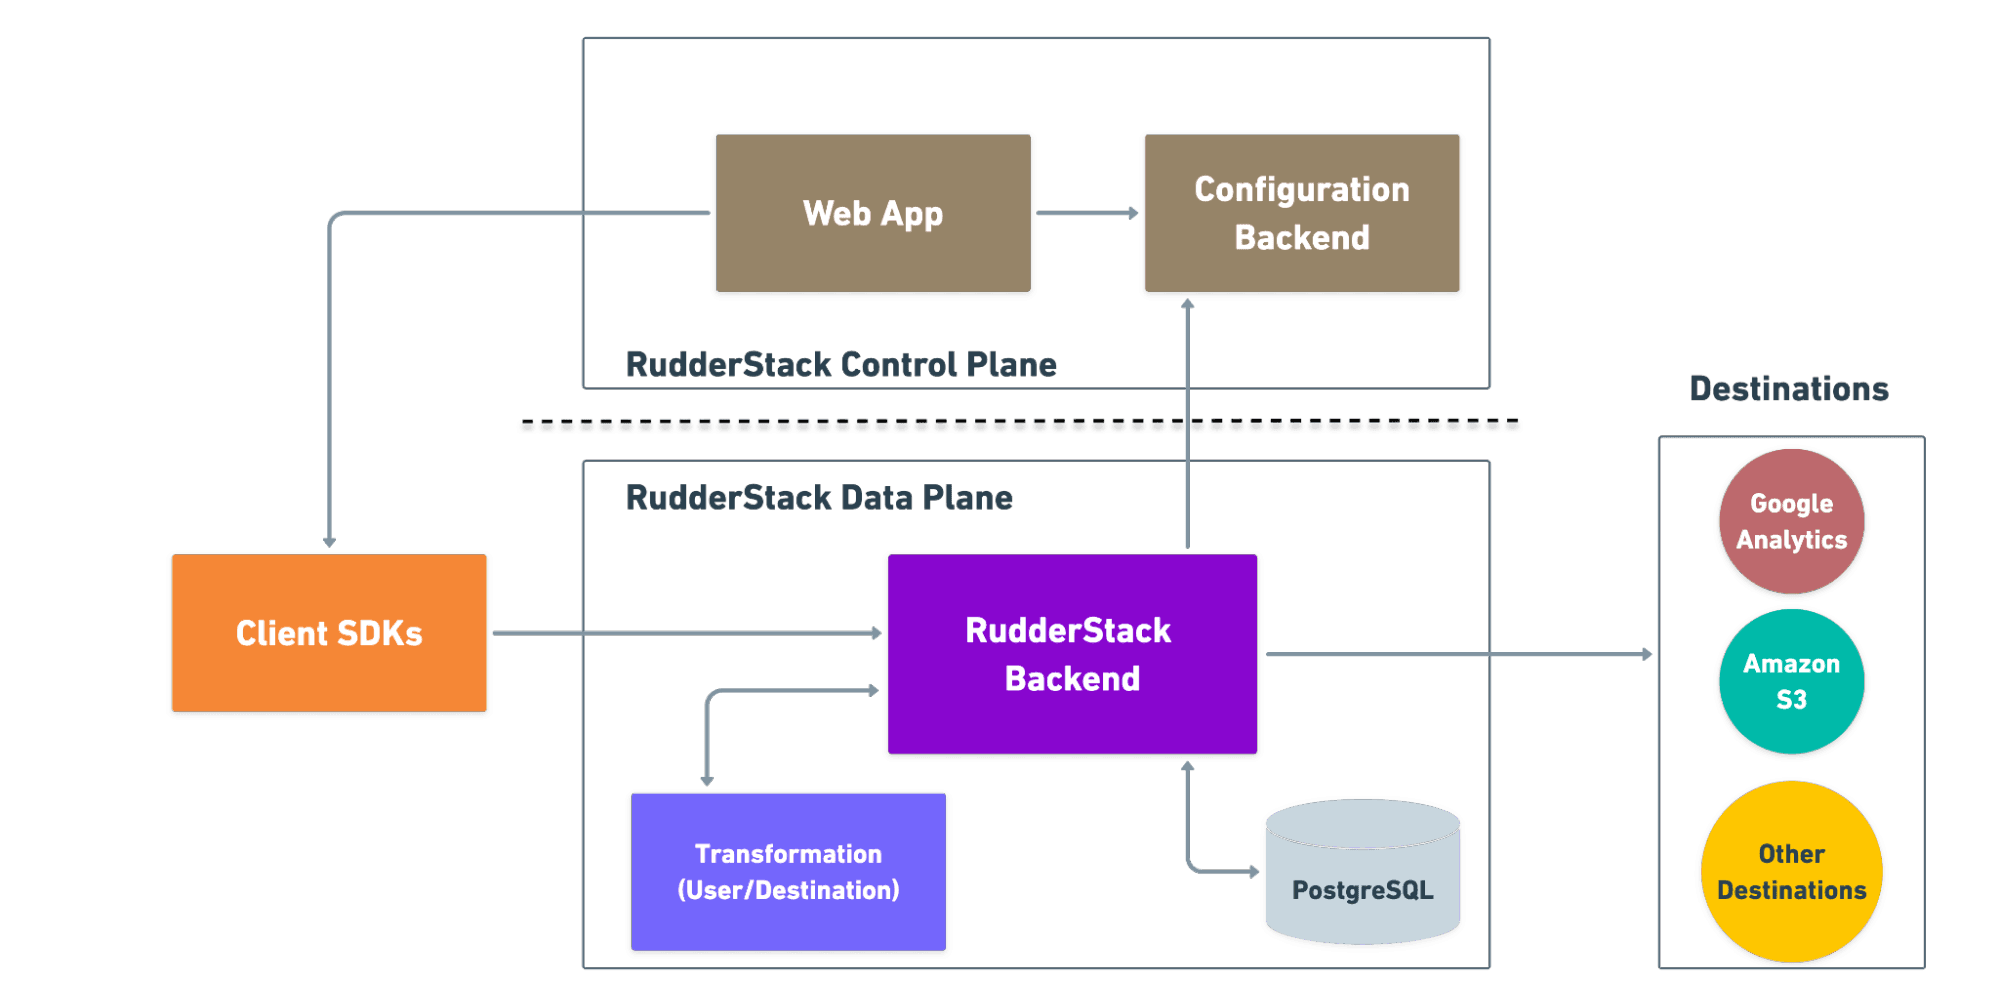
From an architectural perspective, Control Plane consists of a monolith backend application running in cluster mode, several satellite microservices, and a front-end app. For our backend services, we use Node.js and Typescript. We were using ts-node to bootstrap and run the applications, but, as mentioned above, this came at a cost. Let's take a dive to learn more about what was happening.
Solving our startup time problem
We knew node.js itself was not to blame. The native HTTP server restarted almost instantly, and the koa web framework we use is lean and lightweight. So, we needed to do some profiling to pinpoint the cause. We used clinic.js to help us profile because it’s straightforward and easy to use.
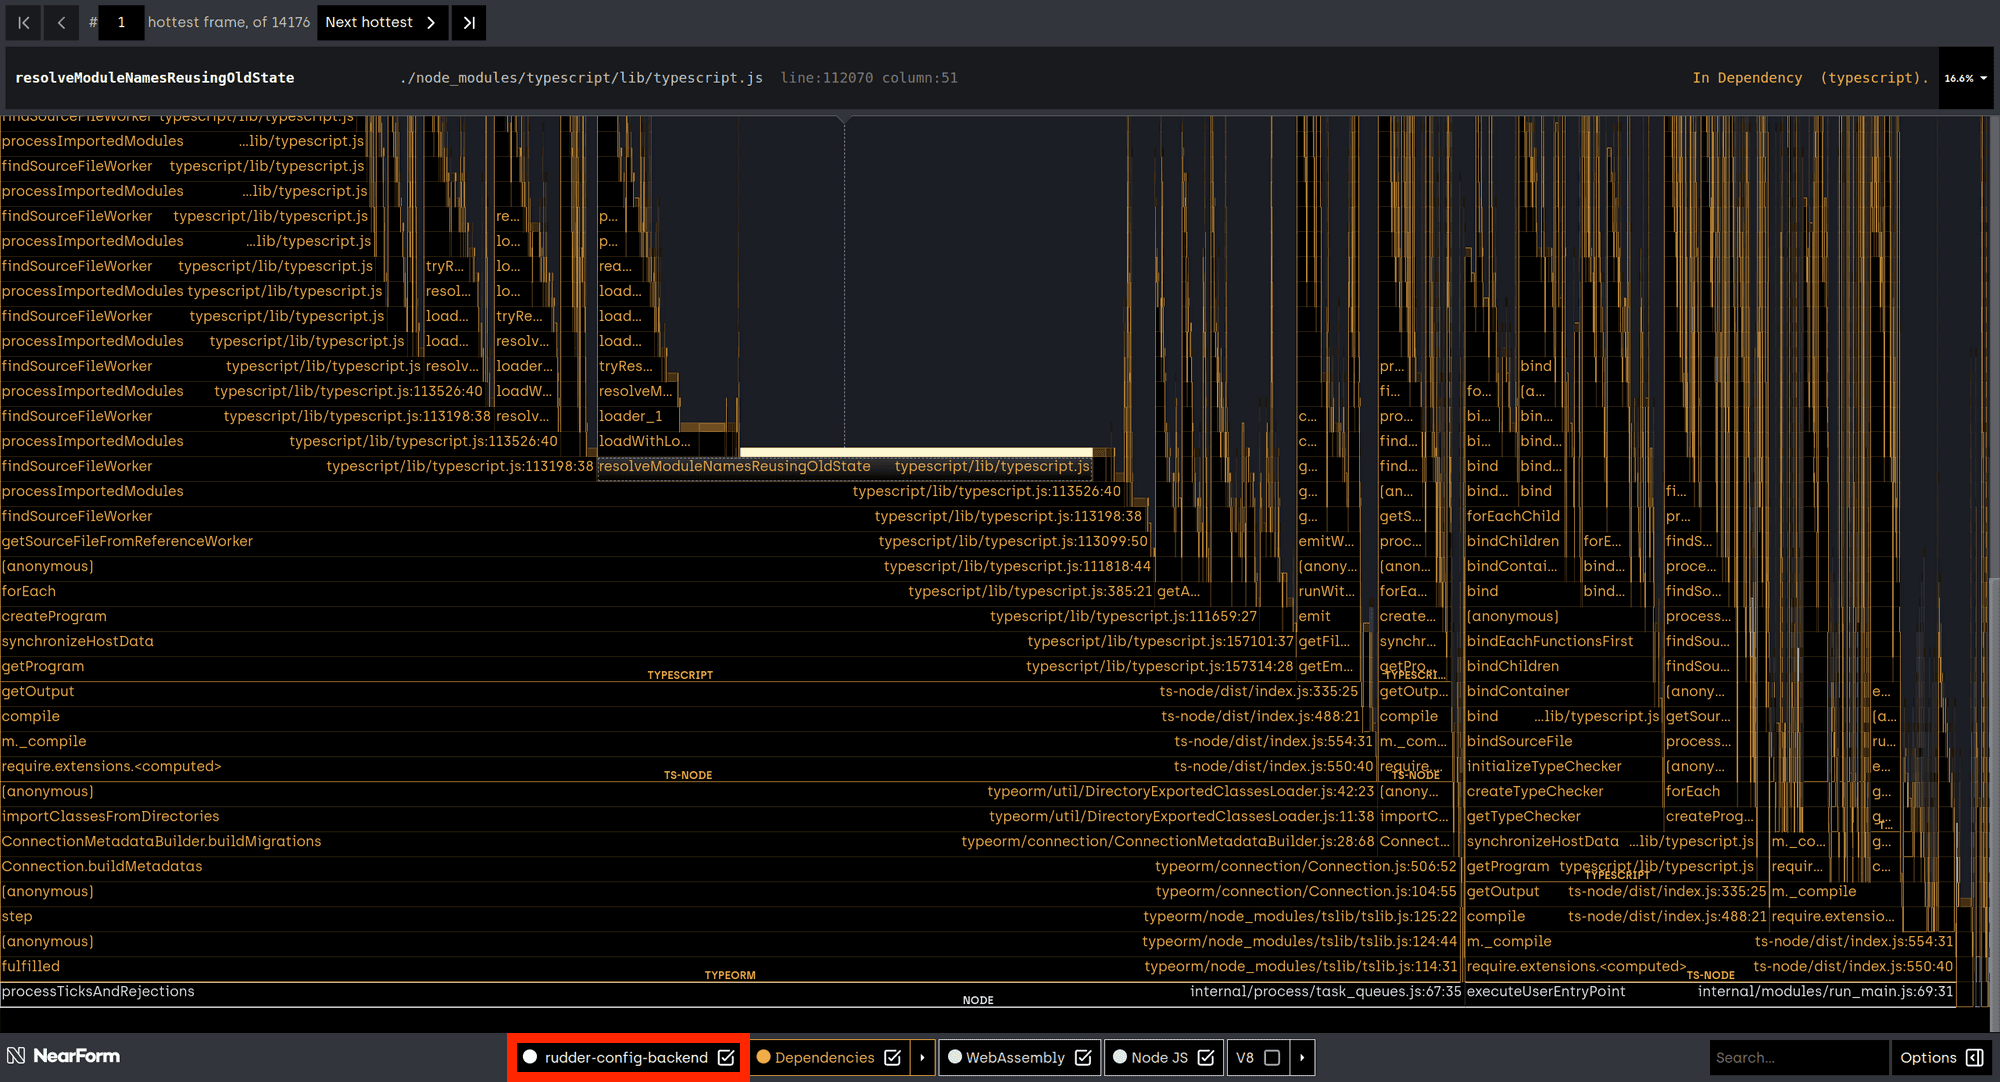
Sure enough, after setting the clinic up and conducting several test runs, we generated some flame graphs (a flame graph is just a fancy way of showing how much execution (CPU) time each method and its dependencies take to complete) that revealed the issue.
A flame graph of the process with source code included:
A flame graph of the process without the source code:
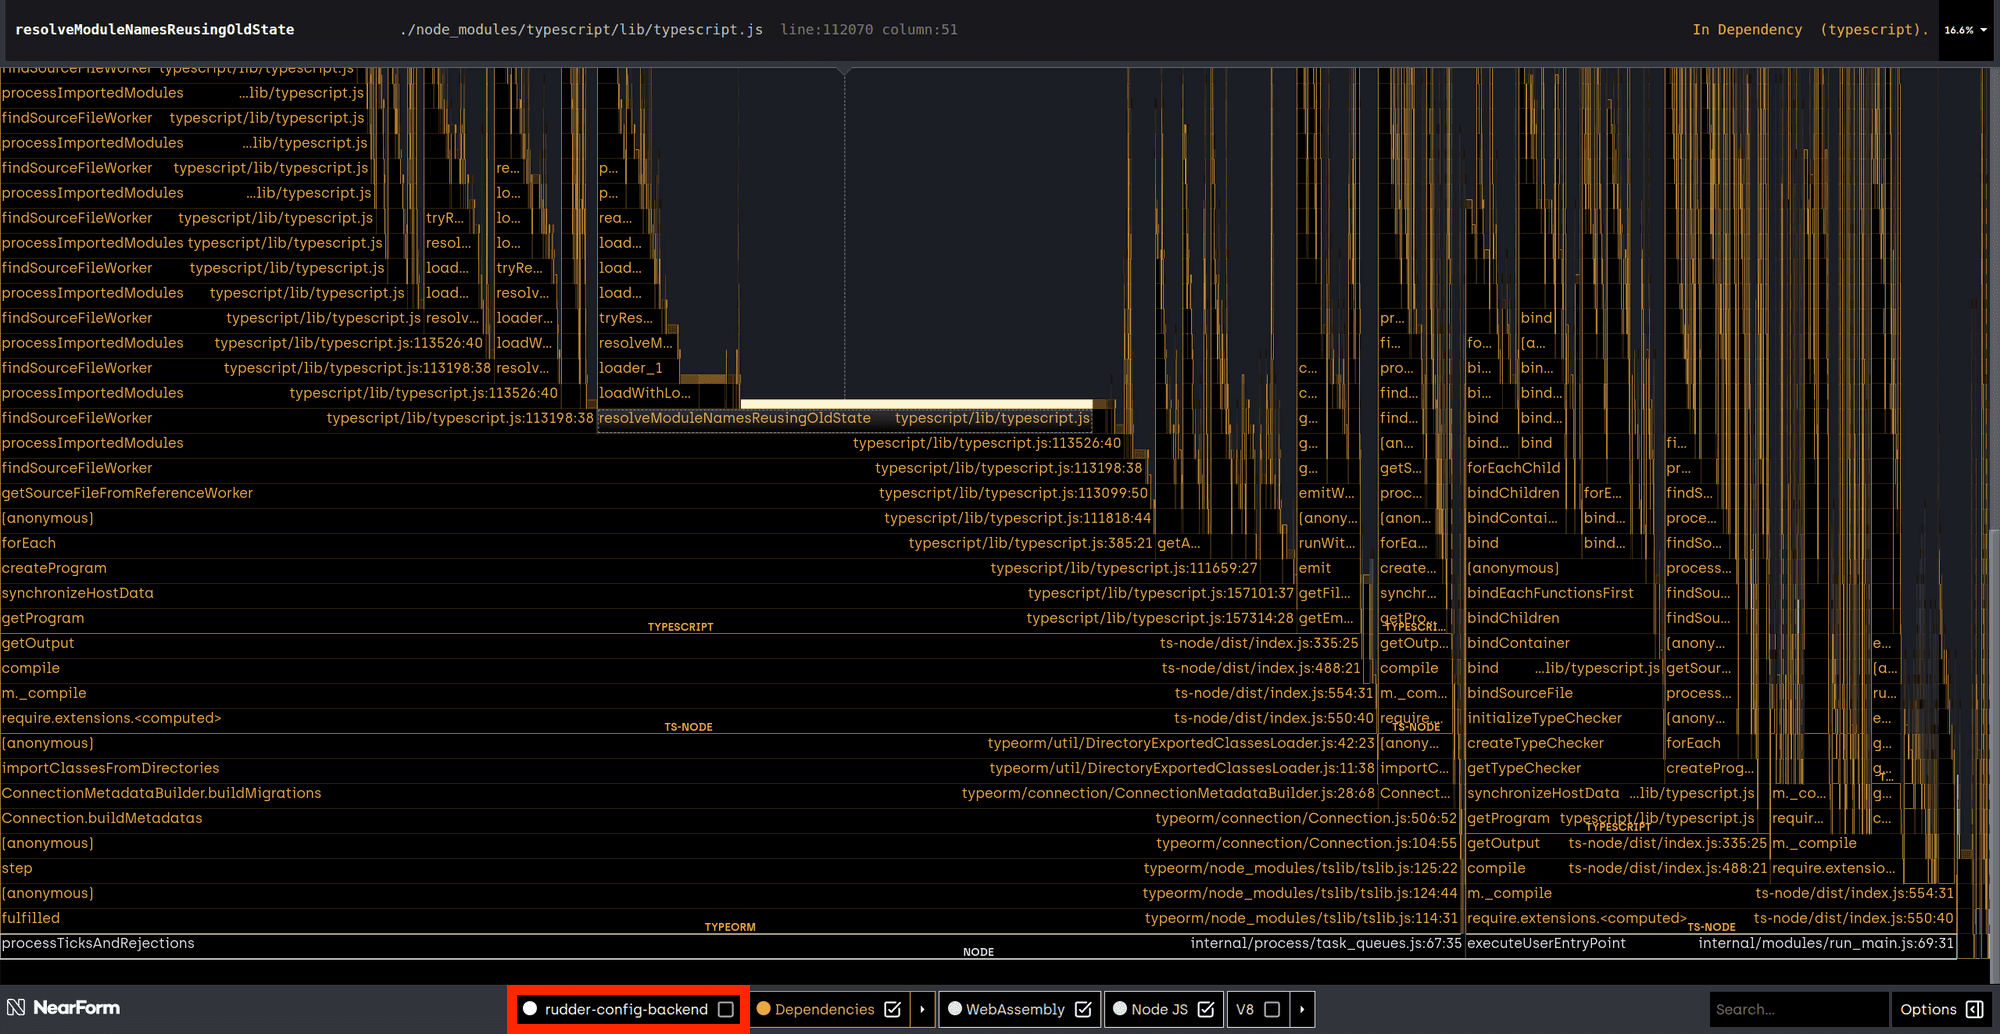
The graphs were the same whether the rudder-config-backend source code was included or not, so we knew the source code wasn’t the issue, and we were able to determine that the overhead came from Typescript, specifically, ts-node.
This made sense because whenever the process restarts, the entire source code has to transpile to javascript from scratch without any caching. This observation also aligned with the larger delay we experienced when deploying the server in cluster mode. Each worker process has to compile typescript files independently, so a restart would take time and sometimes lead to resource starvation. Specifically, we saw Out Of Memory errors and increased CPU utilization during the server startup.
While it is not a bad practice to use ts-node in production (when set up appropriately), in our case, we realized it created significant overhead. But we heavily rely on TypeORM and reflect-metadata, which made ts-node appealing. Removing this dependency would require substantial effort and could lead to further degradation of DX by further limiting our toolset. So, we were left with one option: Remove Typescript.

Well, not remove Typescript entirely, just from production. At least, in theory, having a node process load .js files without the ts-node wrapper would greatly decrease the startup time, as we observed in the second flame graph. Of course, there were a number of different approaches we could take to achieve this, each with its own trade-offs.
Approach one–use tsc
Our initial approach was to use the tsc binary, packaged with the installed Typescript version, and add a transpilation step. This proved trickier than imagined because several engineers developed config-backend over 2 years, following different approaches. So, we ran into a few issues:
- Several dependencies used modules differently, and
tsccan handle only one way at a time - Typescript outputs a true, one-to-one, source to distribution directory, and
importsuse different formats - some were relative topackage.jsonand some were aliases. - Typescript, by design, doesn't modify the import path of dependencies, and node.js with modules has strict expectations about how a file name should be to represent a module
Approach two–extending Typescript with ttypescript and ttsc
Several patches can be used to modify the behavior of tsc to work around Typescript’s transpiling limitations. Unfortunately, these solutions are not very sophisticated. They require a lot of mix and match to cover all the use cases, and they add additional dependencies to the project, such as typescript-transformer-append-js-extension
Taking a step back, we realized we would have to compromise some of the convenience offered by typescript modules and rewrite some parts of the application, especially around importing modules.
But, what if there was a solution that would figure out the dependencies and how to import them in a declarative manner?
Check out RudderStack's High-Performance SDKs
Too many SDK's killing your site or app performance? With RudderStack, you can instrument a single SDK to capture events and send them to every downstream destination.
Enter webpack
webpack is traditionally a JavaScript module bundler, created with the goal to quickly transfer your front-end app to the user’s browser by efficiently segmenting it into chunks. As one of the oldest and most mature bundlers, still actively maintained today, webpack has a vast ecosystem of plugins to suit any kind of complex apps, and it has stellar support for node.js.
Since webpack was built for this purpose, letting it handle module resolution and transpilation of .ts files felt natural vs. the other hacky-ish and monkey-patching approaches. It took us a few tries to make webpack work with TypeORM, mostly because of TypeORM's opinionated assumptions. For example, database migration files must contain a timestamp at the end of the class name, meaning source files can’t be minified and import/export names can’t be mangled. But after a couple of tries we got it working. Sure enough, handling every file through webpack and its plugins streamlined the build process. With efficient caching, subsequent builds are faster, resulting in better DX and shorter deployment windows. A deployment with clustered mode now takes around 12 seconds–down from almost 5 minutes!–to start serving requests. Keep in mind–this is 8 node processes sharing the same resources. Each node process boots up a koa web server and TypeORM connects to the database.
The results were even more outstanding during development:
Before (seconds) | After (seconds | Improvement (%) | |
|---|---|---|---|
Cold start build time | 40 to 90 | 9 to 13 | 77 to 85 |
Hot restart time | Impossible | 0,5 to 0,9 | ∞ |
Server ready | Same as cold start | 1 | 97 to 98 |
Here’s the webpack configuration we used to drastically reduce our start-up times:
1. Install required dependencies
npm install --save-dev webpack webpack-cli @types/webpack-env
webpack and webpack-cli are pretty self-explanatory. The third package, @types/webpack-env, will enable auto-completion for webpack’s require.Context. This is only needed to manually instruct webpack how to handle symbols in a meta-programming fashion, e.g. locate your ORM’s entities in the source code directory and declare them automatically instead of importing each one specifically–we have a gazillion of those!
Note: All of these dependencies should only be used during development and building, no need to carry them in your production build!
2. Create and export your config file
webpack config is pretty straightforward. Just create a webpack.config.js file in your project root directory–usually the folder where package.json is–and export the webpack config. It may look like this:
JAVASCRIPT
3. Add config to instruct webpack where to find your source code and where to build it
JAVASCRIPT
4. Instruct webpack to find your source files
JAVASCRIPT
5. Instruct webpack to read ts files
For this step, you can Install any webpack typescript loader you prefer. We use ts-loader
npm install --save-dev ts-loader
JAVASCRIPT
6. Add externals so webpack doesn't bundle anything it finds (node modules)
npm install --save-dev webpack-node-externals
JAVASCRIPT
7. Don't forget your plugins–webpack is all about plugins!
JAVASCRIPT
Here’s a list of some of the plugins we use. Kudos to the amazing contributors and maintainers!
- nodemon-webpack-plugin–a standard wrapper of nodemon, makes development way faster
- webpack-shell-plugin-next–adds build lifecycle hooks to run cli commands, e.g. build swagger files before you build source files
- fork-ts-checker-webpack-plugin–runs TS type checker on a separate process to increase performance during builds. Note: If you use this make sure to update step 5
module.rules.useto{ loader: 'ts-loader', options: { transpileOnly: true } }sots-loaderdoes not run type checks
Final webpack configuration
Your final webpack configuration should end up looking something like this:
JAVASCRIPT
This optimization paved the way for more
Because we removed Typescript from runtime dependencies, we no longer need it in the final production artifact. So, we got rid of those dependencies completely!
It also inspired us to revise our build pipeline, making it more efficient by introducing multi-stage docker builds with caching layers and different targets for development and production.
Fewer dependencies means:
- A smaller image size
- Less chance of memory leaks from 3rd party code
- Less bandwidth usage
- Faster transfer times
Most importantly, it means smaller attack vectors. With fewer dependencies and less time spent auditing and addressing vulnerabilities, we’re making RudderStack even more secure for our customers.
If you made it this far, thanks for reading along. I hope you found this post useful, and if you enjoy solving problems like this one, come join our team! You can check out our open positions here.
Published:
April 21, 2022


Get started today
Start driving better business outcomes with your customer data in less than a week
Book a demo
Explore use cases with an expert and see RudderStack in action.
Implement RudderStack
Start collecting and enabling real-time customer data everywhere it's needed.
Drive better outcomes
Supercharge your analytics, product, growth, and AI teams.