Transformations Observability
2 minute read
The Events tab of your transformation displays volume metrics for all ingested events, including transformation errors. This is helpful in understanding how the transformed events are flowing through and taking any remedial actions in case of errors.
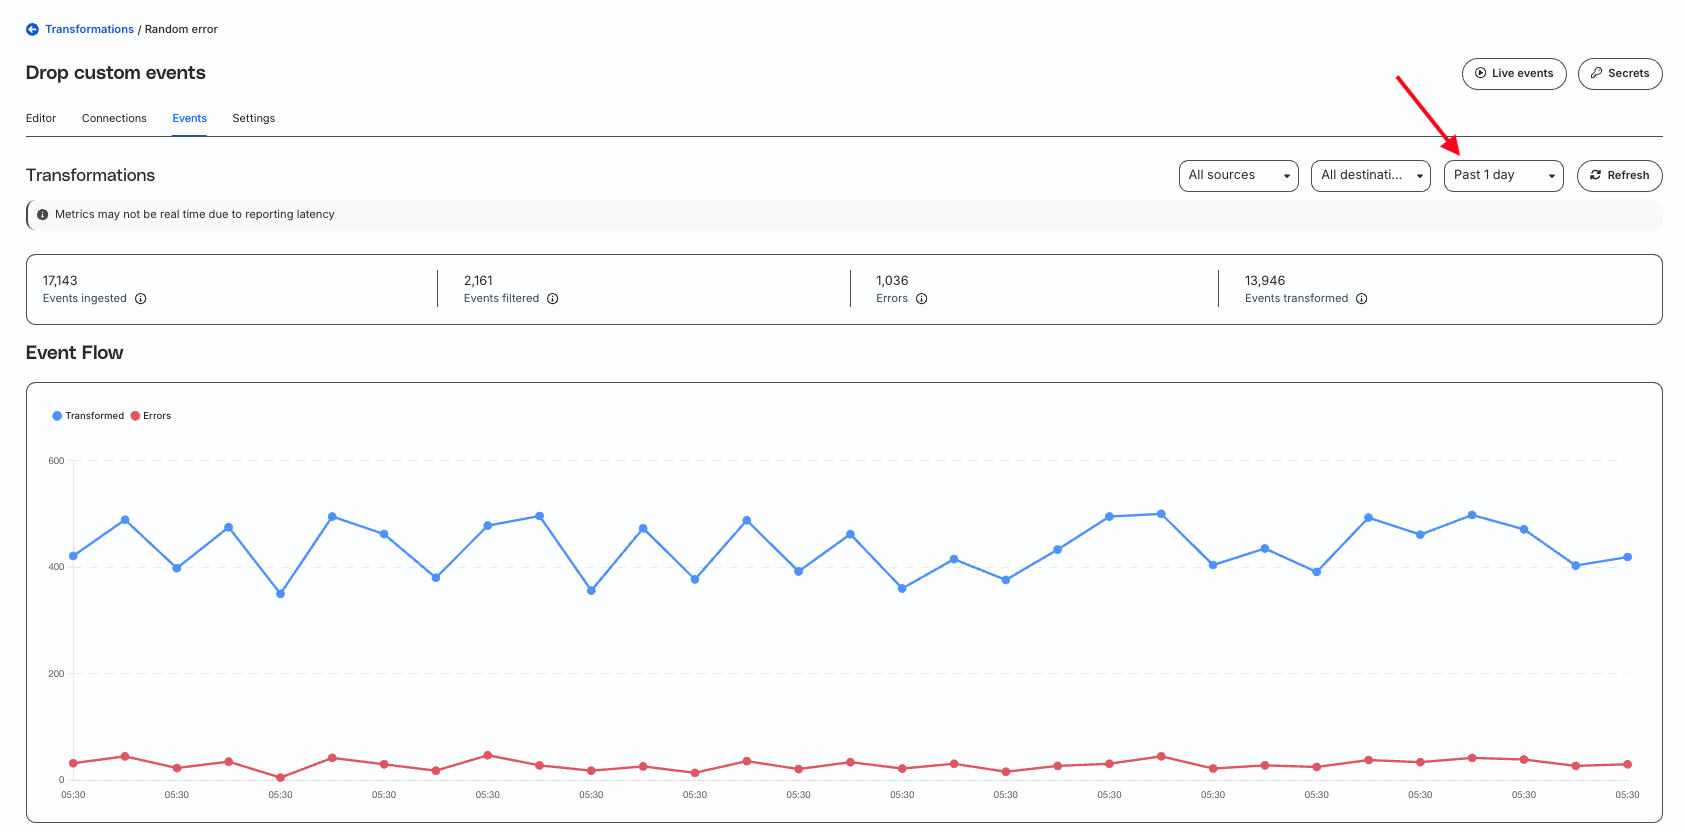
Transformations event metrics
In this section, you get the following event metrics for your transformation:
- Events ingested: Number of events ingested by the RudderStack source.
- Events filtered: Number of events intentionally dropped or filtered by the transformation. For example, if your transformation allowlists only
trackevents with the nameProduct Purchased, any event that does not meet this criteria is dropped. - Errors: Number of events dropped due to transformation errors.
- Events transformed: Number of events successfully transformed and forwarded for further processing.
You can filter and view the metrics for the past 2 hours, 1 day, 7 days, or 30 days.
If you have connected the transformation to multiple destinations, you can view metrics for all destinations or select them individually. You also get the option of filtering the events by sources connected to those destinations.
Transformation errors
This section gives you visibility into the transformation errors. You will see the following details:
| Column name | Description |
|---|---|
| Event type | Type of event, for example, identify, track, etc. |
| Event name | Name of the event in case the type is track. |
| Source | Source from where the event was ingested. |
| Destination | Destination where the transformed event was to be forwarded. |
| Event count | Number of events dropped due to tranformation error. |
| Last seen | Time since the event that caused the transformation error last occurred. |
| Status code | HTTP status code of the tranformation error. |

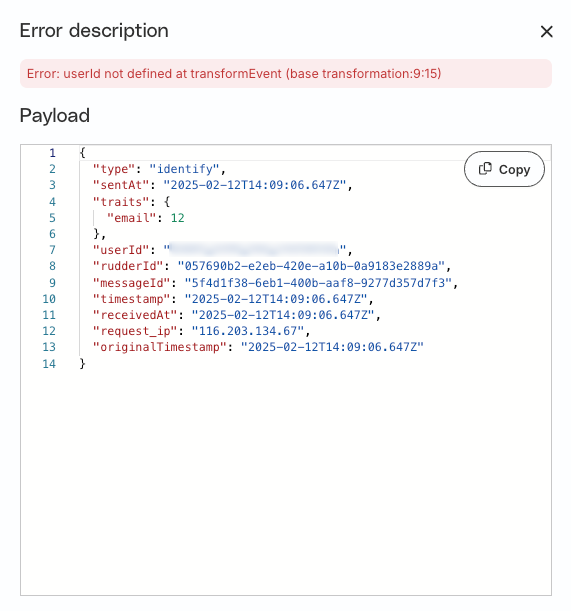
Click Details to see the error description and the event payload: