RudderStack Assistant Interface Reference
9 minute read
This guide provides a reference to all tabs and features in RudderStack Assistant.
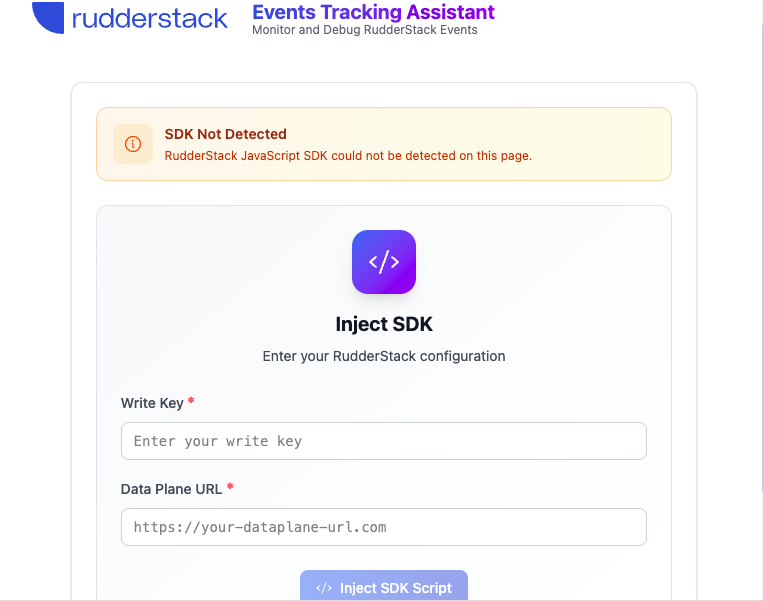
If no SDK is detected on the page, you will see the SDK injection interface instead of the below tabs.
Home tab
The Home tab provides a quick overview of your RudderStack implementation health. Use it to quickly identify if there are any issues with your implementation.
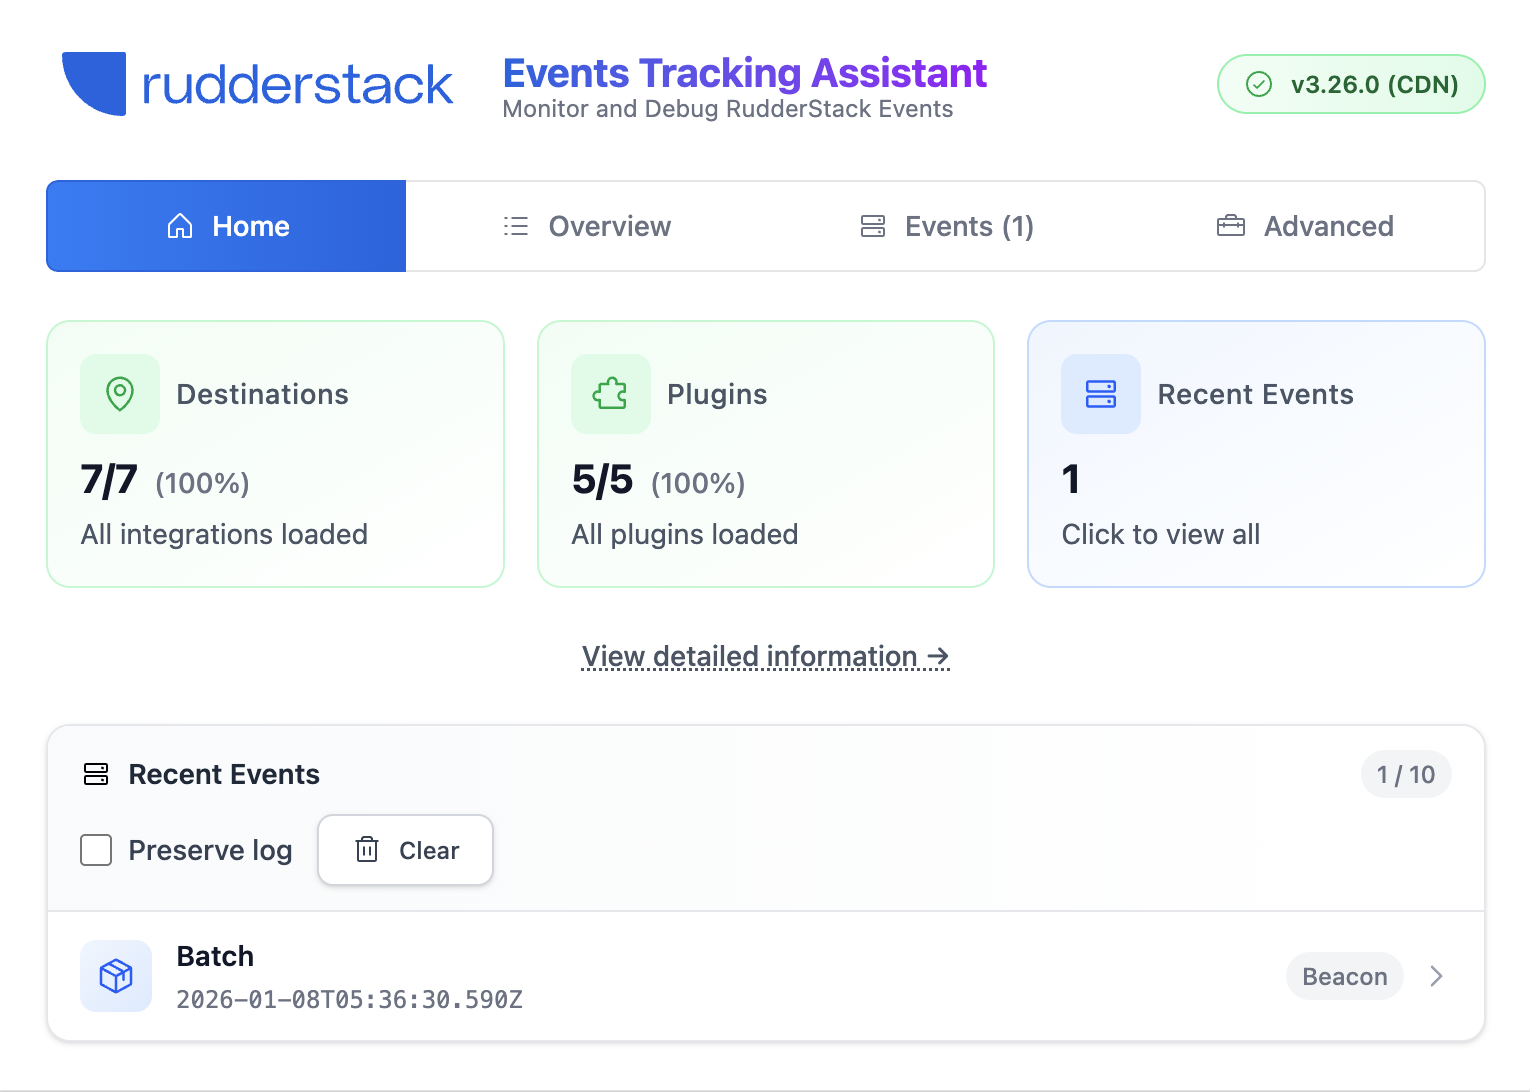
SDK status
Shows the current lifecycle state of the SDK:
- Ready: The SDK has fully initialized
- Initializing: The SDK is loading
- Stalled: The SDK hasn’t initialized within the expected timeframe
Destinations
Shows the total count of device-mode destinations with a breakdown by status loaded, failed, or filtered.
Plugins summary
Shows the total count of plugins with a breakdown by status — loaded or failed.
Recent events
Shows the last 10 events captured. Events are grouped by page URL, and each URL group is collapsible.
| Detail | Description |
|---|---|
| Event type | identify, track, page, group, alias |
| Event name | Name of the event (for track events) or event type |
| Timestamp | Time when each event was sent |
| Event payload | Click any event to view its full payload |
| Preserve logs | Option to preserve event logs across page navigations |
Overview tab
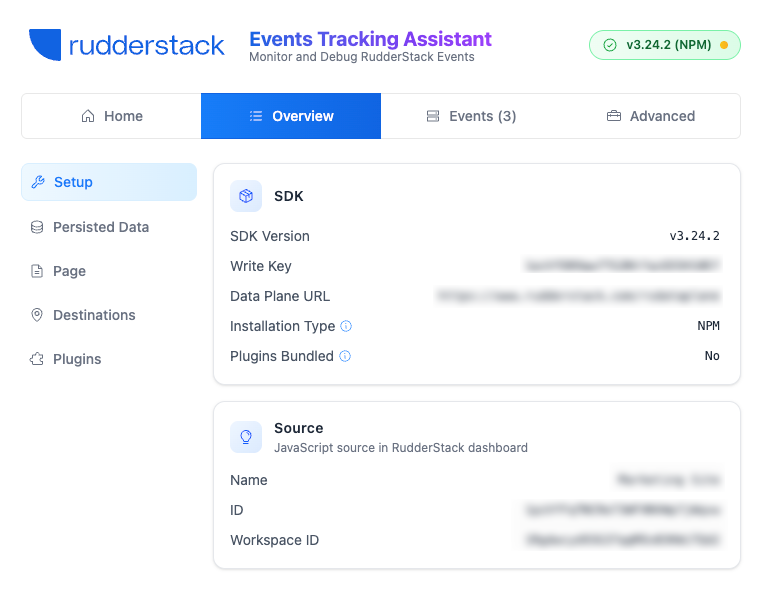
The Overview tab provides detailed information about your SDK setup, organized into sections accessible from the left sidebar.
Look for the ⓘ icon next to field names for additional context and explanations.
Setup
The Setup section is divided into two cards: SDK and Source.
SDK
View essential SDK configuration details:
| Detail | Description |
|---|---|
| SDK Version | The version of the RudderStack JavaScript SDK in use |
| Installation Type | CDN or NPM installation method |
| Snippet Version | The version of the RudderStack snippet used to load the SDK |
| Plugins Bundled | Whether plugins are bundled with the SDK |
Expand Advanced information to view additional low-level SDK configuration details.
Source
View your RudderStack source details:
| Detail | Description |
|---|---|
| Name | RudderStack source name |
| ID | Source ID |
| Workspace ID | RudderStack workspace ID |
| Write Key | JavaScript source write key used in the web page integration |
| Data Plane URL | Your data plane URL |
Click Live events to open the source’s live events view in the RudderStack dashboard.
Persisted Data
Inspect data stored by the SDK in browser storage. This section helps you verify that user and session data is being captured correctly.
| Detail | Description |
|---|---|
| User | Anonymous ID, User ID, User Traits |
| User Group | Group ID, Group Traits |
| Session | Session ID, session tracking mode, timeout, expiration time |
| Page | Initial Referrer, Initial Referring Domain |
Each field shows the storage type used by the SDK to store the data (local storage, session storage, cookies, or memory).
Page
View current page information. This section helps you verify that page context is being captured correctly for your events.
| Detail | Description |
|---|---|
| Page URL | Current page URL |
| Canonical URL | Canonical URL (if specified) |
| Page Title | Page title |
| Referrer | Referring page URL |
Destinations
Monitor device-mode destination loading status. This section helps you troubleshoot why specific destinations aren’t loading or receiving data.
| Detail | Description |
|---|---|
| Successfully loaded destinations | Destinations that loaded correctly |
| Failed destinations | Destinations that failed to load with error details |
| Filtered destinations | Destinations filtered due to consent, configuration, or other reasons |
| Device-mode transformations | Shows whether device-mode transformations are enabled and their loading status.
|
Some common reasons for destination failures include:
- Destination not configured correctly
- Integration SDK blocked by ad blockers
- Incorrect base URL configuration
- Slow CDN response
Plugins
Track plugin loading status. This section helps you troubleshoot why specific plugins aren’t loading or receiving data.
| Detail | Description |
|---|---|
| Successfully loaded plugins | Plugins that loaded correctly |
| Failed plugins | Plugins that failed to load with error details |
Events tab
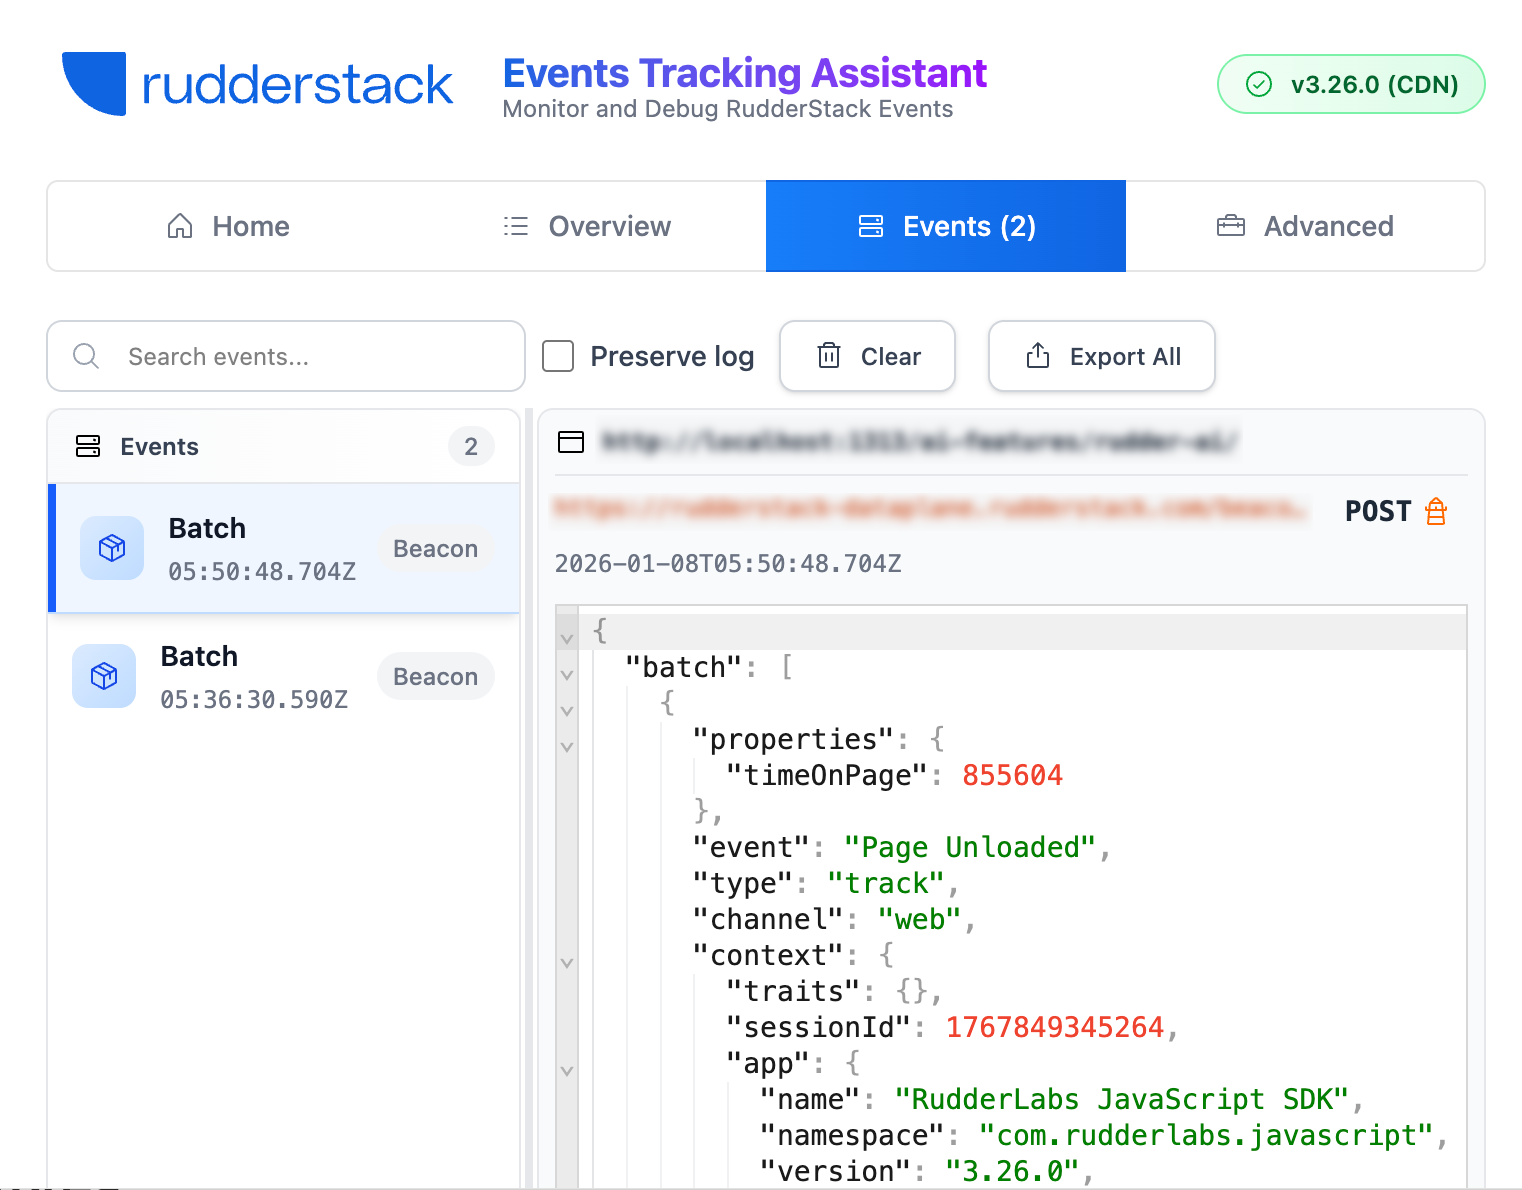
The Events tab provides real-time monitoring of all events sent through RudderStack. It shows a resizable split view — the event list on the left and event details on the right.
Event list
Events are grouped into collapsible sessions by page URL, with a boundary indicator showing when navigation occurred.
| Detail | Description |
|---|---|
| Event type | Color-coded icons for identify, track, page, group, and alias events |
| Event name | Name of the event (for track events) or event type |
| HTTP status code | Status codes for successful or failed requests |
| Beacon indicator | Shows “Beacon” for events sent via the Beacon API — these don’t return HTTP status codes |
| Timestamp | Time when each event was sent (in UTC) |
Use the search and filter controls to narrow down events:
| Control | Description |
|---|---|
| Search bar | Search events by name, type, or payload value |
| Aa | Toggle to make the search case-sensitive |
| ab | Toggle to match whole words only |
| Failed-only filter | Show only events with failed HTTP status codes |
Event details
Click any event in the event list to view the following details:
| Detail | Description |
|---|---|
| Complete event payload | Formatted JSON showing all event data |
| Request URL | The endpoint URL where the event was sent |
| HTTP method | GET or POST |
| HTTP status | Response status code |
| Sent | Timestamp and relative time when the event was sent |
| Transport method | XHR or Beacon API |
Keep the extension open before triggering events. The extension can only capture events sent after it is opened on the page.
Preserve logs
Lets you keep your event history across page navigations. This setting is helpful when you want to:
- Track event flow across multi-page user journeys
- Debug checkout or signup flows that span multiple pages
- Analyze events before and after navigation
- Retain event history when testing page transitions
| Detail | Description |
|---|---|
| Preserve logs | Enable to retain events when navigating to new pages |
| Clear | Clears all events in the log |
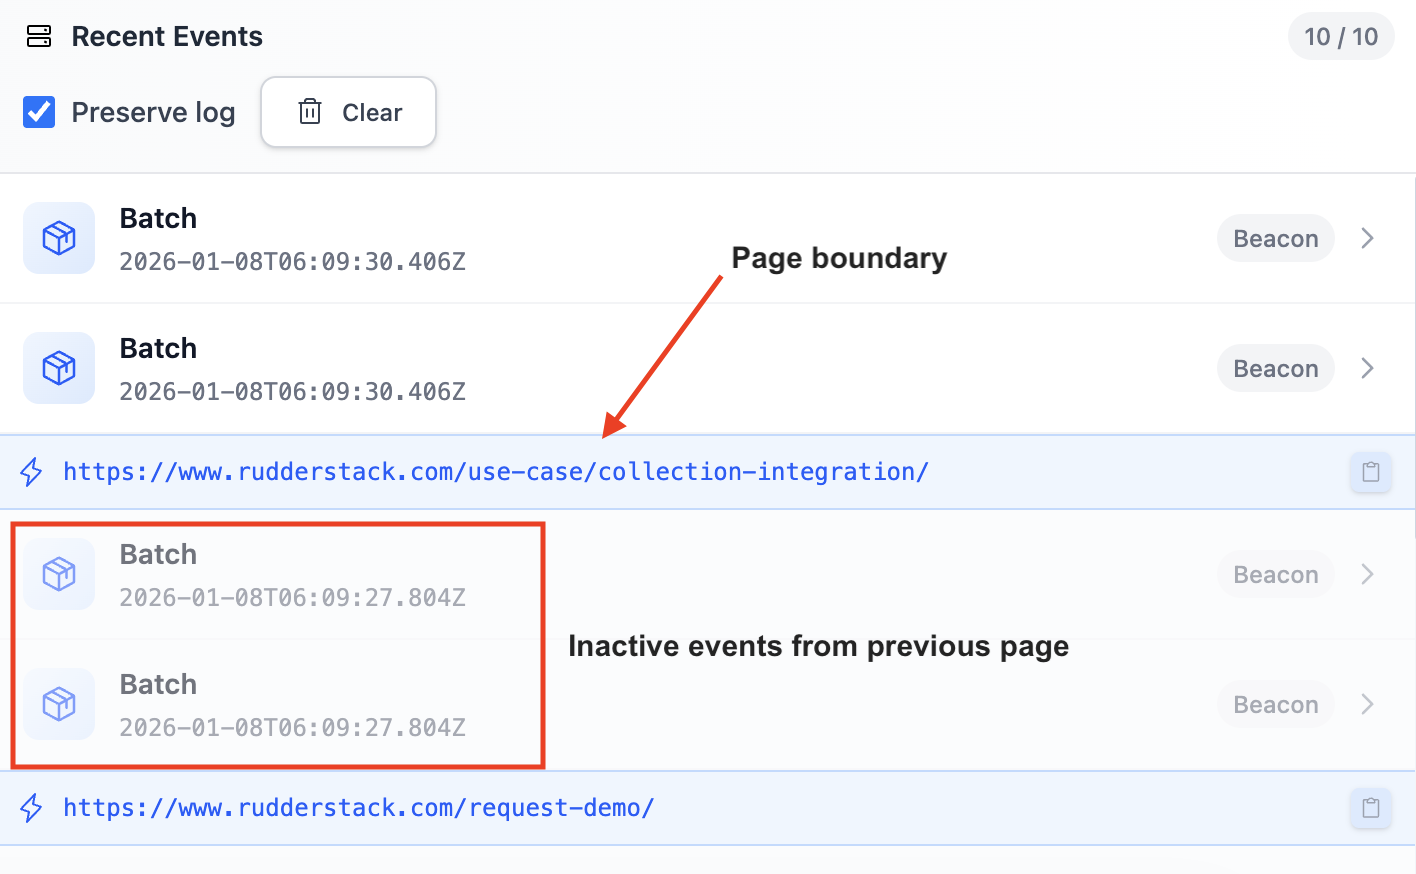
This feature works on a per-tab basis and remembers your preference. When enabled:
- Events are marked as inactive (with reduced opacity) after page navigation
- You will see page boundaries showing the URL where navigation occurred
- Events persist until you manually clear the log or close the tab
Export events
| Detail | Description |
|---|---|
| Export all events | Download all captured events as a JSON file |
Advanced tab
The Advanced tab contains tools for deeper debugging and configuration verification. Use the left sidebar to navigate between sections.
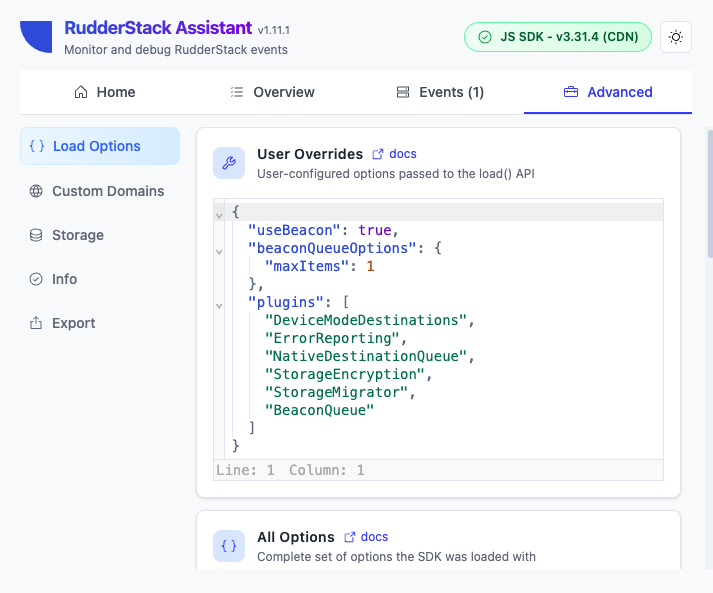
Load options
Inspect the SDK options passed during initialization. This section helps you verify the configuration passed to load().
| Card | Description |
|---|---|
| User Overrides | The options you configured in the load() API call |
| All Options | The complete set of options the SDK was loaded with, including defaults |
Both cards display values as formatted, collapsible JSON with links to the relevant documentation.
Custom domains
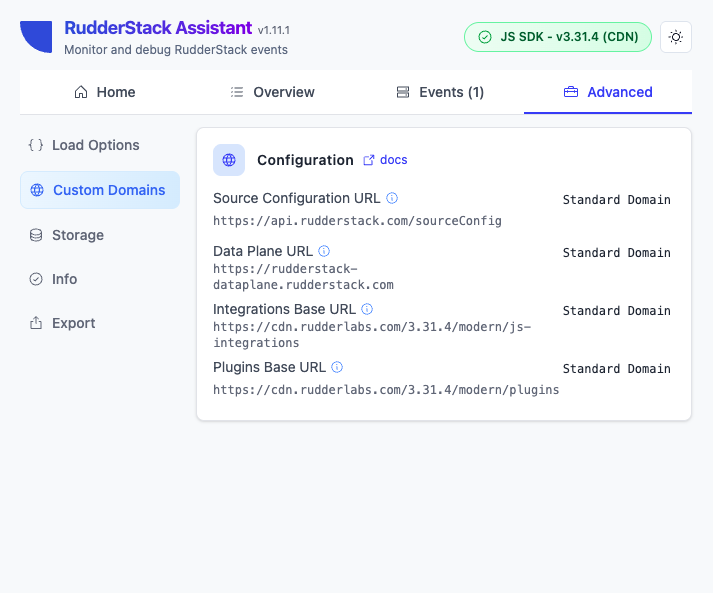
Check if you’re using custom domains — this section helps you verify proxy configuration and troubleshoot CORS or loading issues. The actual URL in use is shown below each field name.
| Detail | Description |
|---|---|
| Source Configuration URL | Custom domain for loading source configuration |
| Data Plane URL | Custom domain for sending events to the data plane |
| Integrations Base URL | Custom domain for loading device-mode destination SDKs |
| Plugins Base URL | Custom domain for loading SDK plugins |
Each field shows either Standard Domain or Custom Domain to indicate whether you’re using a proxy.
Storage
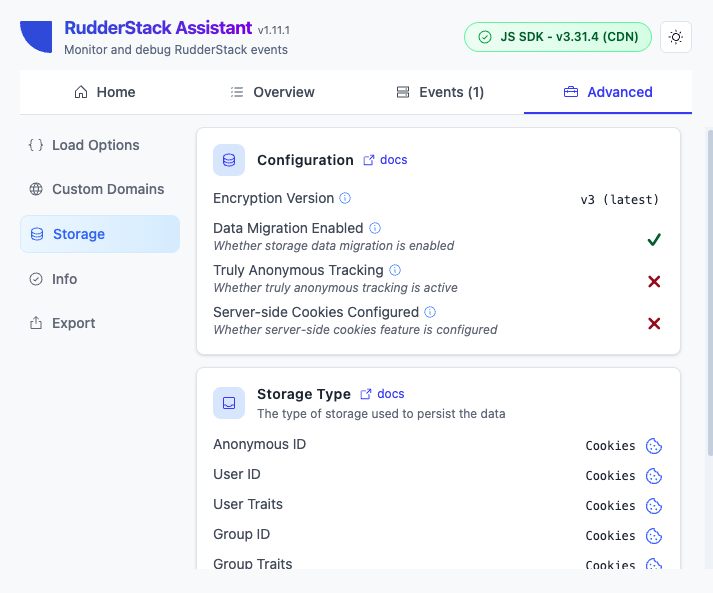
View detailed information about browser storage usage. This section helps you debug storage-related issues and verify storage configuration.
Configuration
| Detail | Description |
|---|---|
| Encryption Version | The version used to encrypt data persisted in browser storage |
| Data Migration Enabled | Whether persisted data encrypted using the legacy encryption method is migrated to the latest format |
| Truly Anonymous Tracking | Whether cookieless tracking is enabled. With this feature, each event has a unique anonymous ID and no user data is stored. |
| Server-side Cookies Configured | Whether server-side cookies are configured. If configured, the SDK makes requests to the analytics data server to set cookies via the response headers. |
Storage Type
Shows the storage type (local storage, session storage, cookies, or memory) used for each data category, such as Anonymous ID, User ID, User Traits, Group ID, and Group Traits.
Info
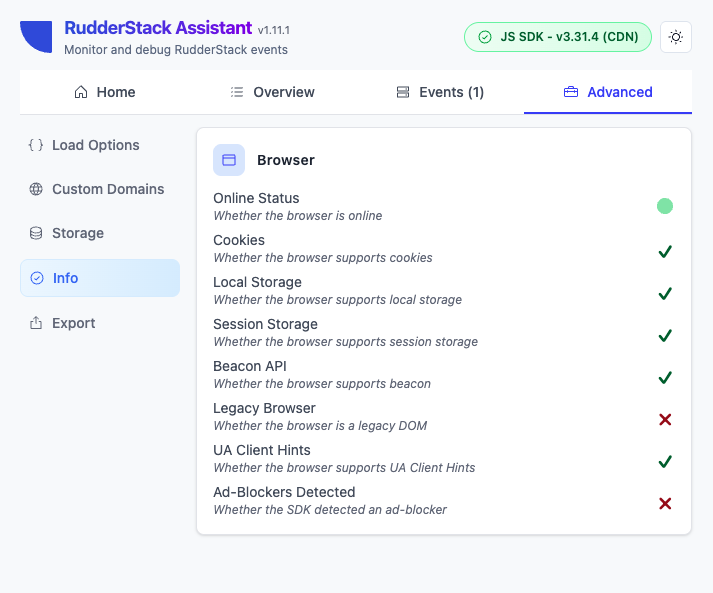
Check browser and SDK capabilities — this section helps you understand browser limitations that might affect SDK functionality.
| Detail | Description |
|---|---|
| Online Status | Whether the browser is online |
| Cookies | Whether the browser supports cookies |
| Local Storage | Whether the browser supports local storage |
| Session Storage | Whether the browser supports session storage |
| Beacon API | Whether the browser supports the Beacon API |
| Legacy Browser | Whether the browser is a legacy DOM |
| UA Client Hints | Whether the browser supports User-Agent Client Hints |
| Ad-Blockers Detected | Whether an ad-blocker is detected on the page |
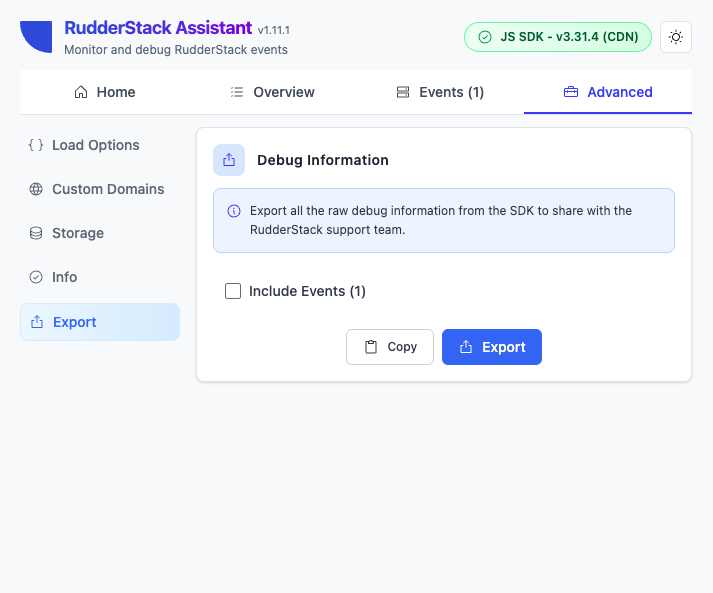
Export
The extension does not include any PII data in the export.
Click Export to download comprehensive SDK debug information as a JSON file:
- Complete SDK state
- Configuration details
- Source information
- Session data
- Loaded destinations and plugins
- Optional: Enable Include Events to add captured events to the export. The number of captured events is shown in the checkbox label.
Export debug data when contacting support or for detailed analysis. Include events if you need to share event payloads.
You can copy the debug data to your clipboard or download it as a JSON file.
SDK injection
Not all sites support injecting scripts due to strict Content Security Policy (CSP) headers.
The extension indicates if injection is not supported. Use SDK injection for testing purposes only. For production use, install the JavaScript SDK on the website.
If no RudderStack JavaScript SDK is found on the page, the extension offers manual injection:
- Enter your Write Key.
- Enter your Data Plane URL.
- Optional: Select the auto-track options you want to enable.
- Optional: Enable Auto-inject on navigations to automatically re-inject the SDK when the page navigates.
- Click Inject SDK Script.
Auto-track options
When injecting the SDK, you can enable automatic event tracking for common user interactions. Select one or more options before clicking Inject SDK Script:
| Option | Description |
|---|---|
| Page view | Automatically sends a page view event when the SDK is injected |
| Form submits | Automatically tracks form submission events on the page |
| Clicks | Automatically tracks click events on interactive elements |
| Scroll depth | Automatically tracks scroll depth as users move down the page |
Auto-inject on navigations
Toggle Auto-inject on navigations to automatically re-inject the SDK when you navigate to a new page during testing. When disabled, you need to inject the SDK again on each page load.
If injection fails due to CSP or Trusted-Types restrictions, the extension displays an inline error message indicating the cause.
Global controls
Use the following keyboard shortcuts to navigate and search faster:
| Shortcut | Action |
|---|---|
/ | Focus the search bar in the Events tab |
? | Show the keyboard shortcuts reference |
Esc | Close the active panel or overlay |
See also
- RudderStack Assistant: Learn about RudderStack Assistant and its features
- Quickstart: Installation and basic usage of RudderStack Assistant
- Troubleshooting: Solutions to common issues while using RudderStack Assistant
