Grafana dashboard
- growth
- enterprise
7 minute read
RudderStack’s Grafana dashboard gives you detailed insights into your RudderStack server’s performance. You get a real-time view of the events sent and received by RudderStack along with various metrics like RudderStack’s performance under load, errors encountered while processing events, event delivery statistics, and more.
This guide explains the various Grafana dashboard options and performance metrics in detail.
Set up Grafana dashboard
Contact RudderStack Support to enable the Grafana dashboard for your RudderStack account and for any assistance in the setup.
Terminology
This section covers some standard terms you are likely to see when using the Grafana dashboard:
| Term | Description |
|---|---|
| Warehouse | Data warehouses like Redshift, BigQuery, Snowflake, PostgreSQL, etc. - which RudderStack currently supports. |
| Batch router | Object storage destinations like Amazon S3, Google Cloud Storage, Azure Blob Storage, MinIO, and DigitalOcean Spaces - which RudderStack currently supports. |
| Router | All the connected destinations other than the two categories mentioned above. |
| User transformation | RudderStack’s Transformations feature which lets you enrich real-time events using custom JavaScript functions. |
| Destination transformation | RudderStack’s internal service which transforms the event payload into a destination-specific format. |
| Gateway | RudderStack’s internal service responsible for ingesting the incoming events. |
| Processor | RudderStack’s internal service responsible for processing new events, applying user transformations, and destination transformations. |
Dashboard overview
RudderStack’s Grafana dashboard gives insight into the total number of requests and the events received and delivered via RudderStack.
RudderStack stores all the performance metrics in Mimir, where Grafana queries them and gives you a detailed visual overview.
The following video explains the different dashboard options in detail:
Received requests
Number of HTTP requests RudderStack has received in the selected time period.
Received events
Number of events RudderStack has received in the selected time period. You can batch multiple events in a single HTTP request.
Delivered events
Number of events RudderStack has delivered across all destinations during the selected time period.
If you have set up a warehouse destination in RudderStack, each event is delivered to two different tables in the warehouse and counted as two delivered events.
Gateway
Gateway requests
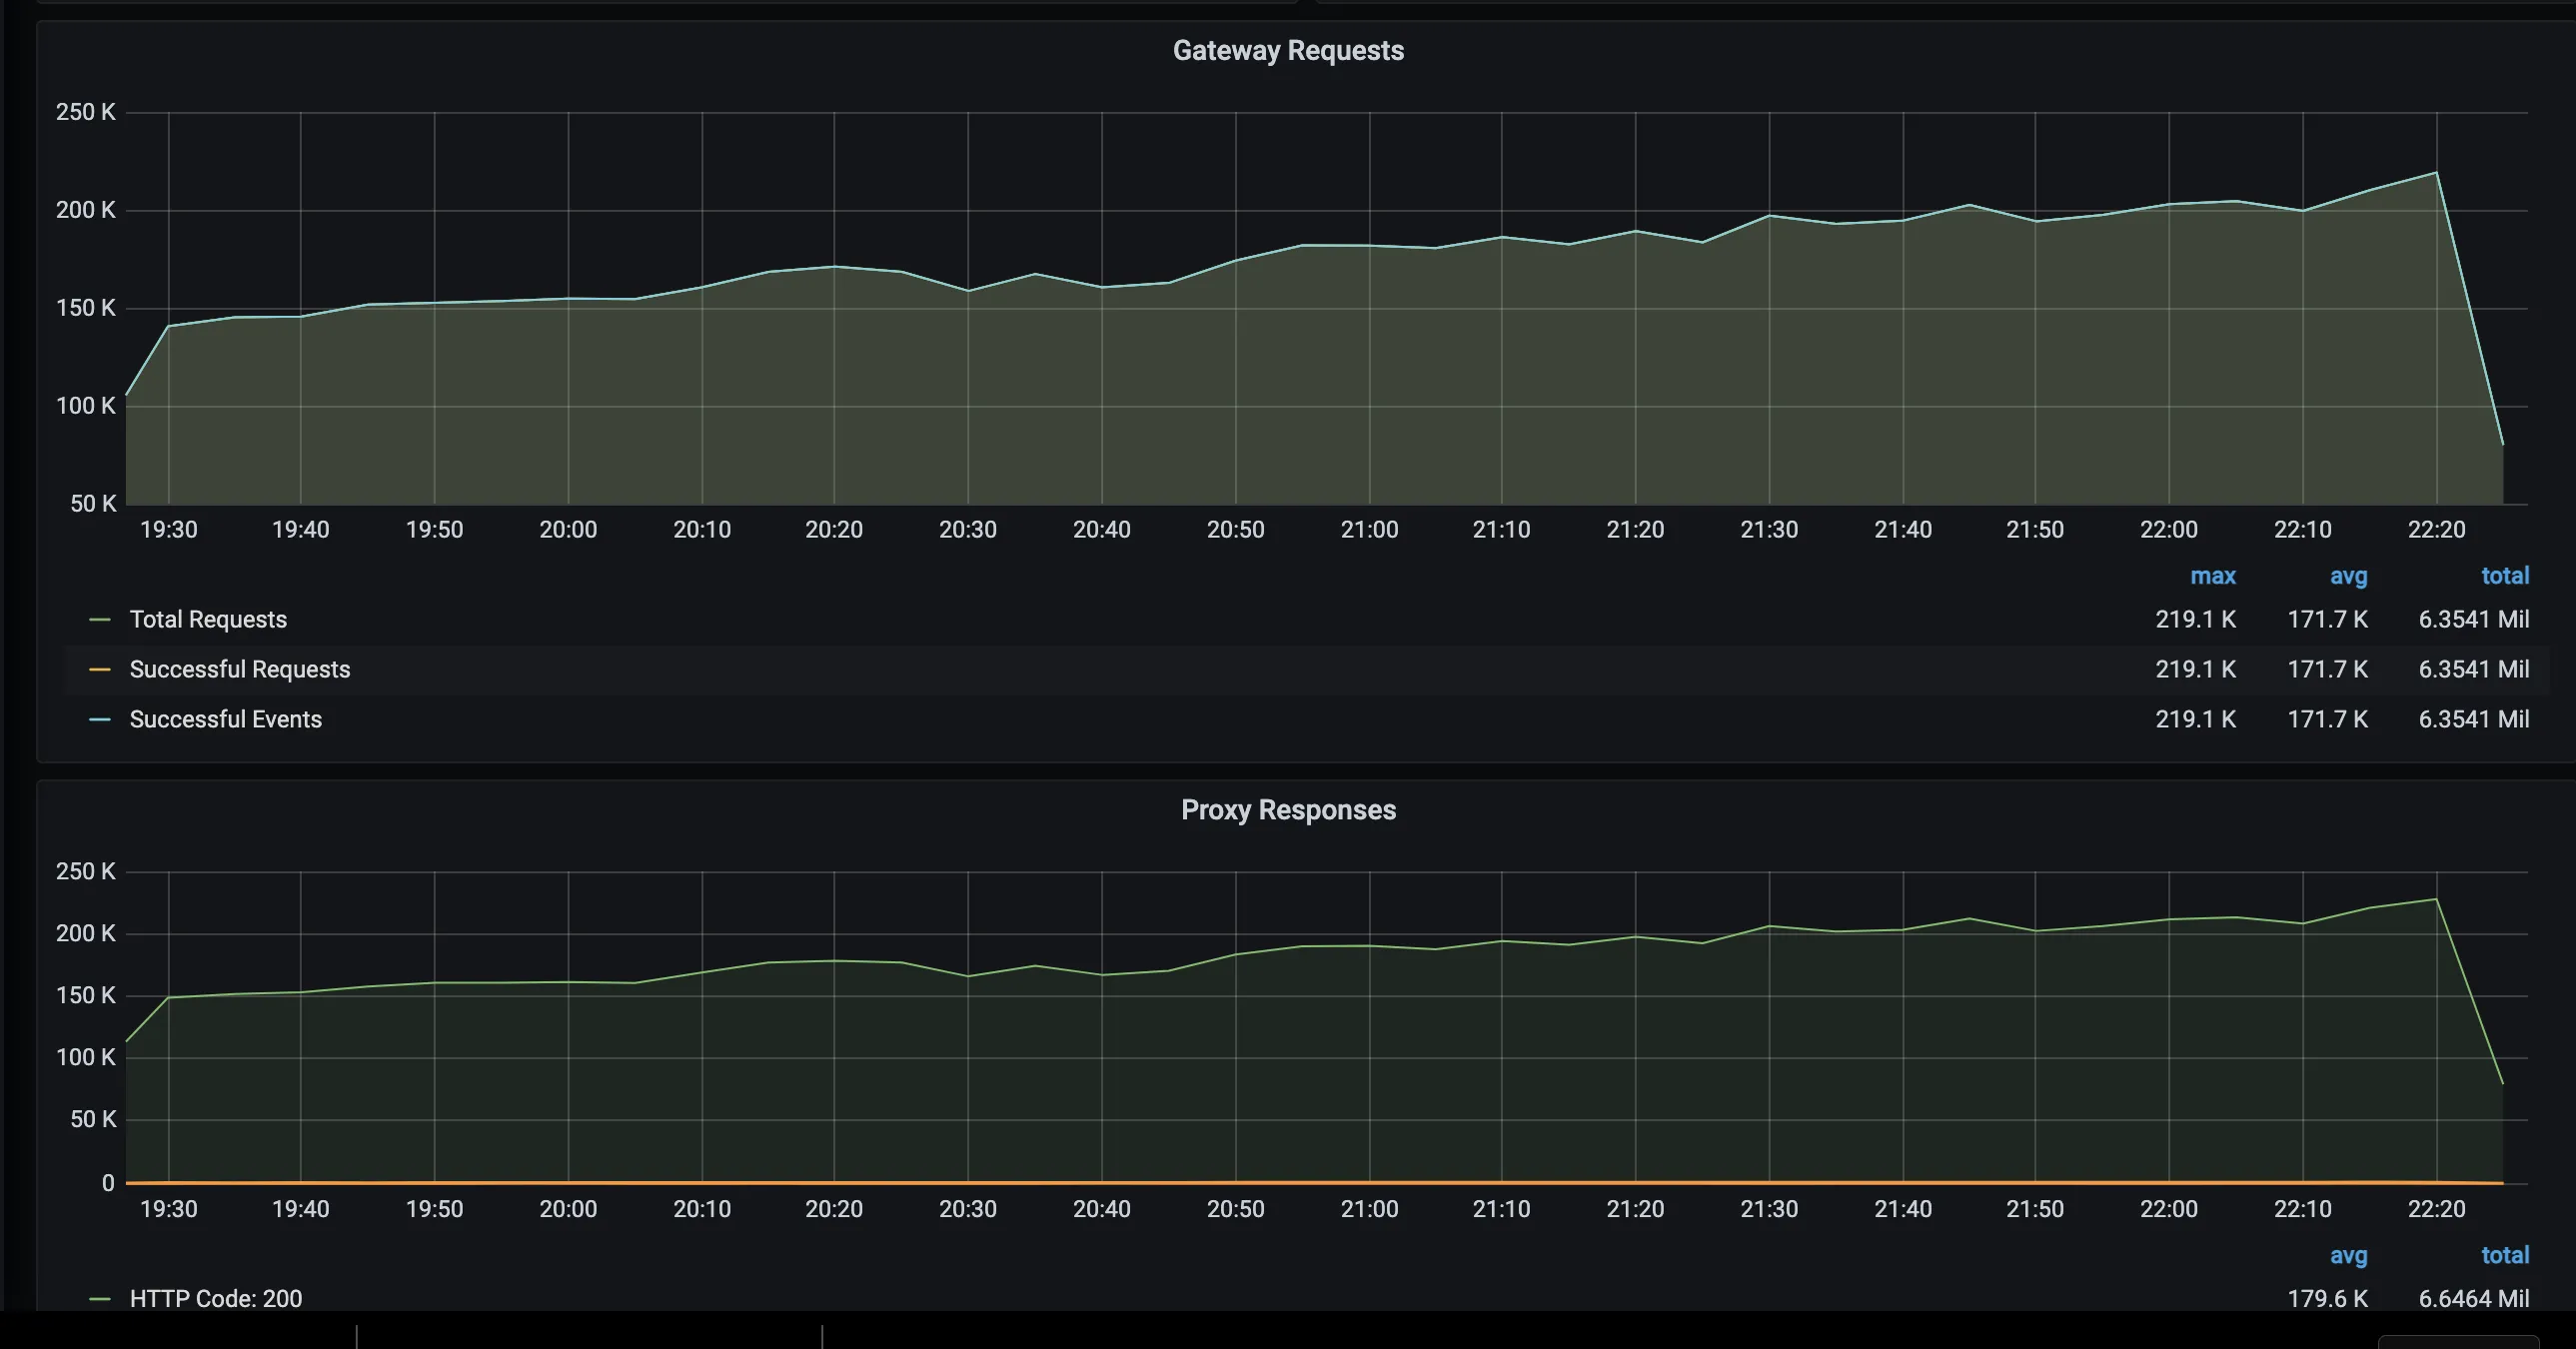
Number of requests HTTP requests RudderStack has received across all sources in the selected time period. You can find the details of an individual source in the Gateway Detailed section of the dashboard.
Proxy responses
RudderStack has a reverse proxy in front of the RudderStack nodes. This panel lists all HTTP response codes. You can find a 4xx status if the requests are invalid and a 5xx status if the service is down or has encountered an internal error.
Request latency
RudderStack stores the events in the gateway (PostgreSQL) and acknowledges them. RudderStack lists the time to acknowledge these HTTP requests with 99 percentile, 95 percentile, and mean times.
Gateway throughput
RudderStack’s processor module picks events from the gateway for further processing. If Input Requests > Output Requests then the inflow is higher than what the processor can handle.
This scenario usually occurs during a sudden traffic surge but syncs over some time. However, if the event inflow is consistently higher, consider adding an extra RudderStack node.
Event delivery
Events delivered - batch router
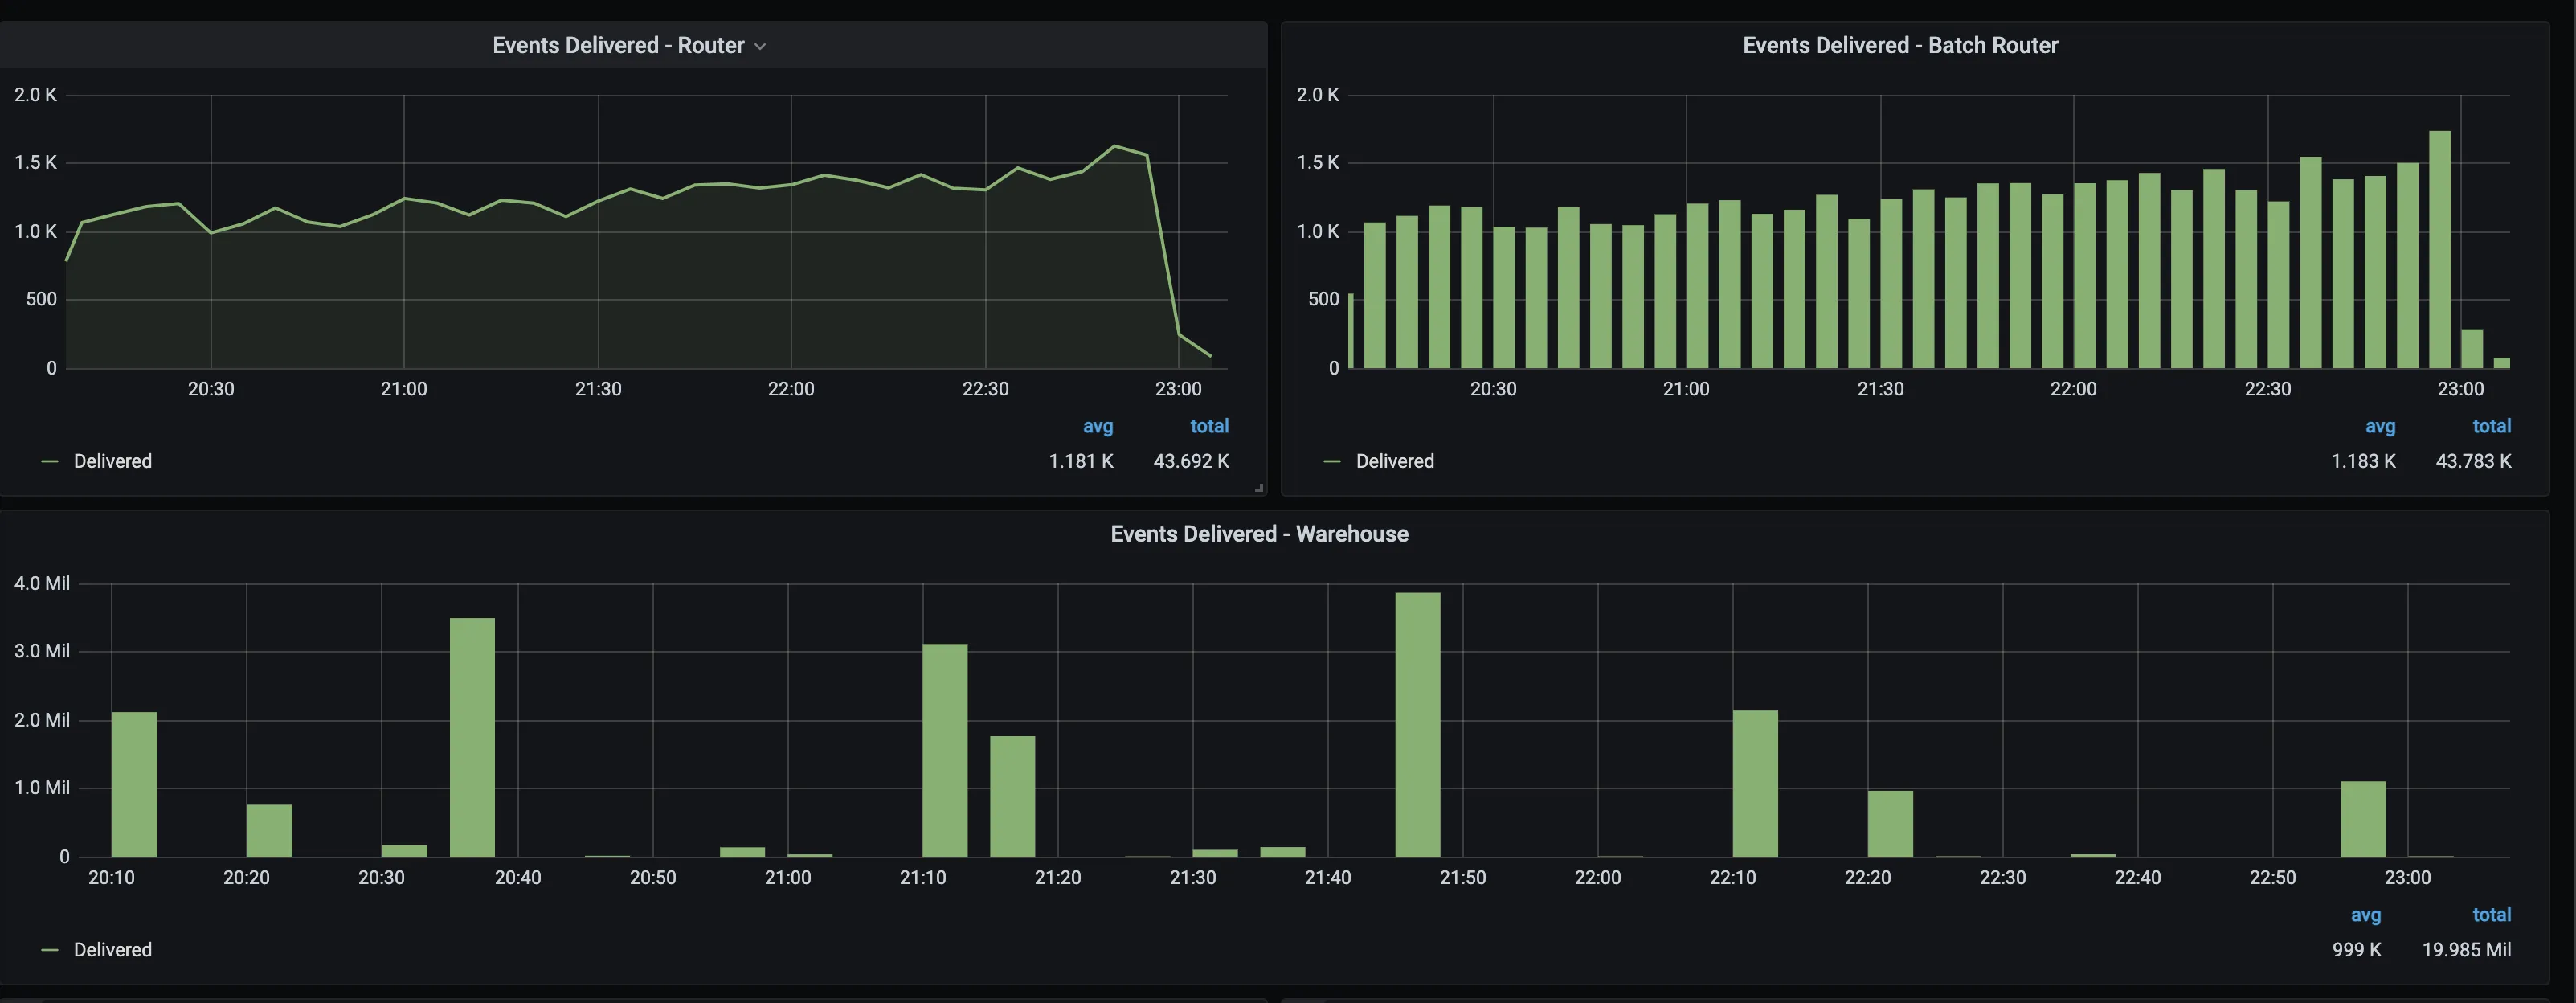
Number of events delivered to the object storage destinations.
Events delivered - warehouse
Number of events delivered to the data warehouse destinations.
Events delivered - router
Number of events delivered to all other destinations except object storage and warehouse destinations.
Event delivery time
Event delivery time - batch router
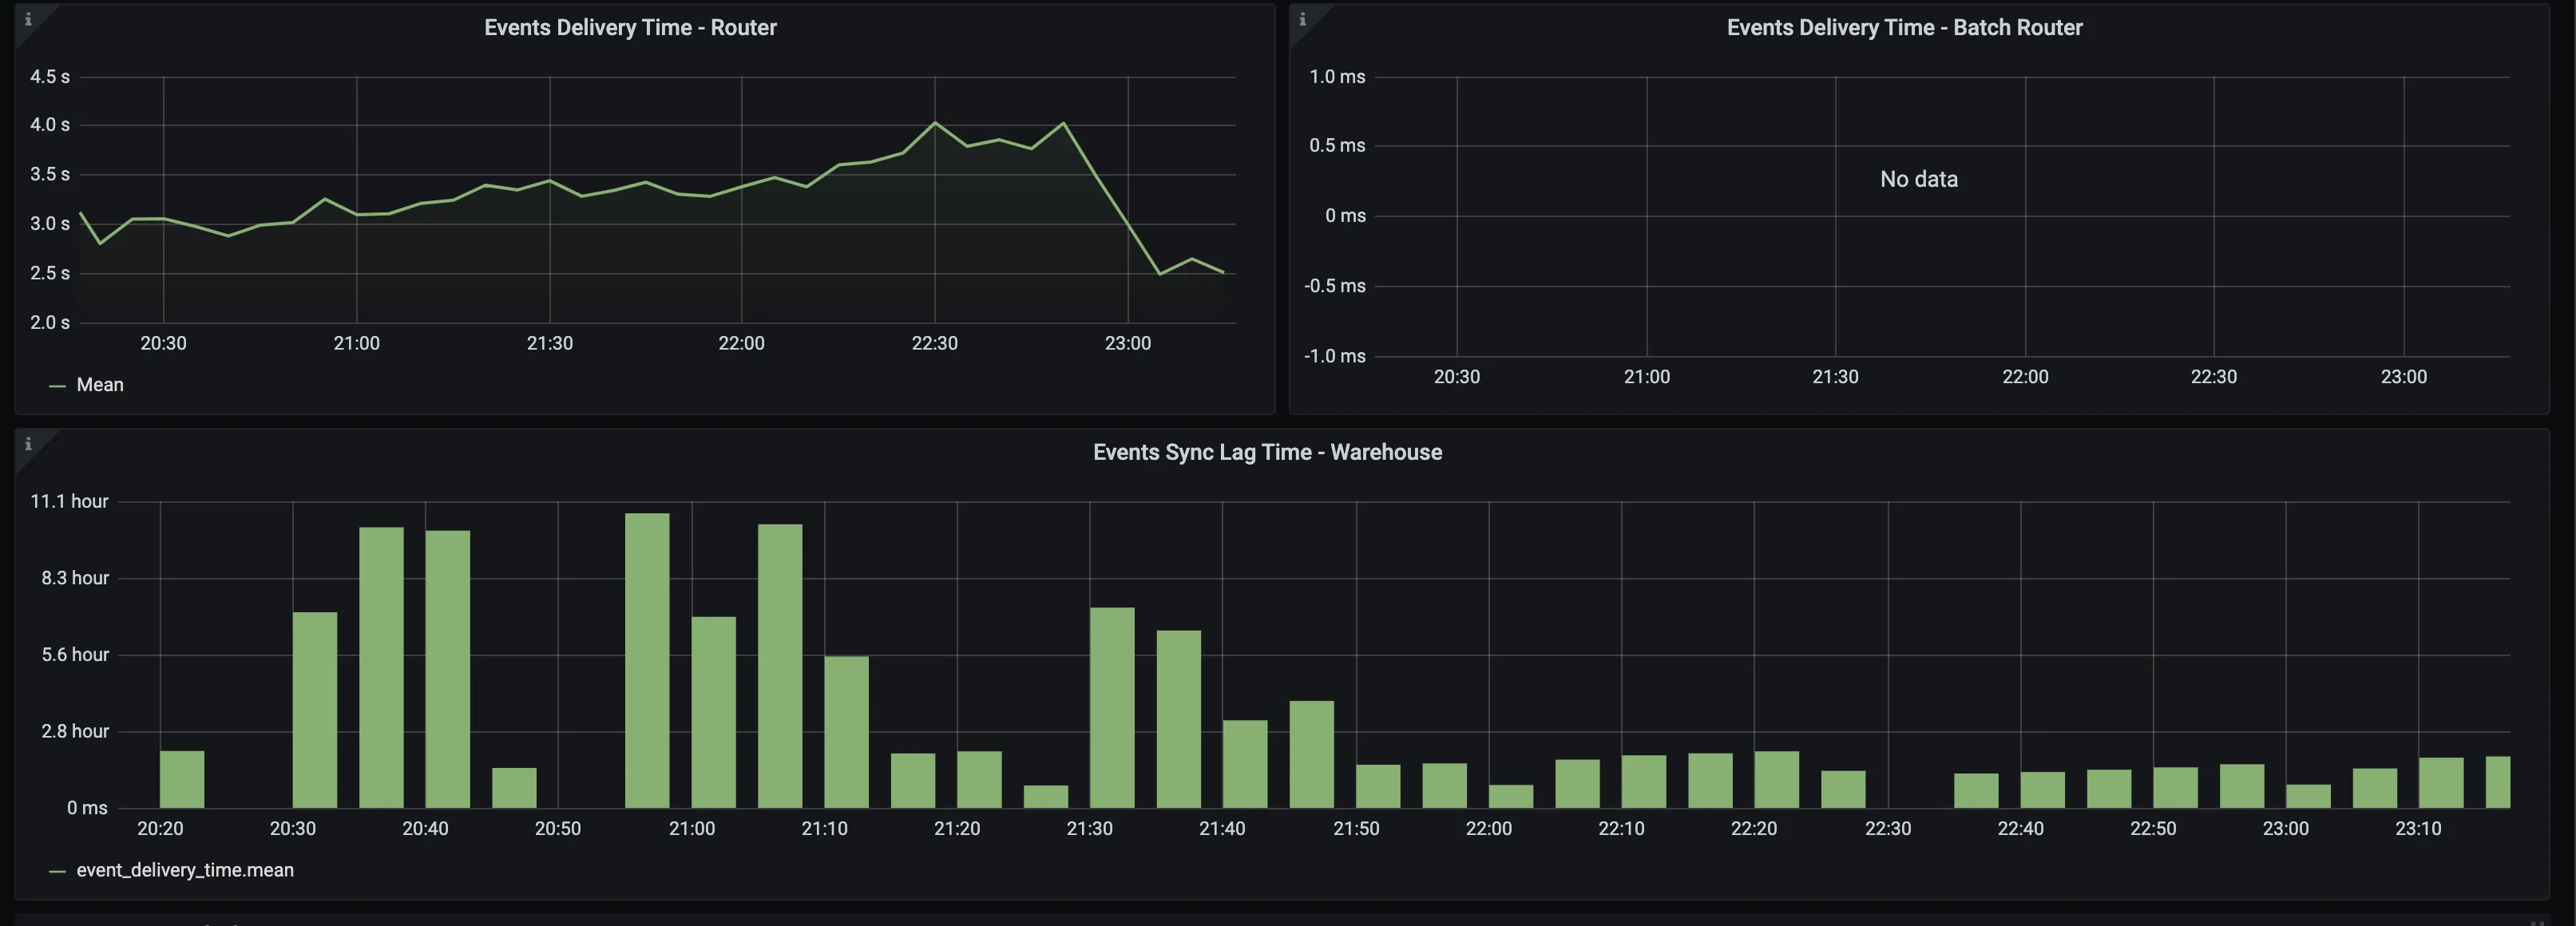
Average time taken for delivering events to the object storage destinations. RudderStack batches events every 30 seconds (default value), so this is the least time taken to batch and deliver the events.
Events sync lag time - warehouse
Highlights the largest sync delay for delivering events to the warehouse destination. RudderStack batches events at a frequency based on your plan (for example, 30 minutes for the Growth plan) before uploading to the data warehouse, so the delivery takes at least this much batching period.
This metric reports the lag for the oldest event in a batch. For example, if the batching period is 30 mins and the reported lag time is 50 mins, then the average lag time would be 50 - \(30/2\) = 35 mins.
Event delivery time - router
Average time taken to deliver events to all other destinations except object storage and warehouse destinations.
Processor
Active processed destinations
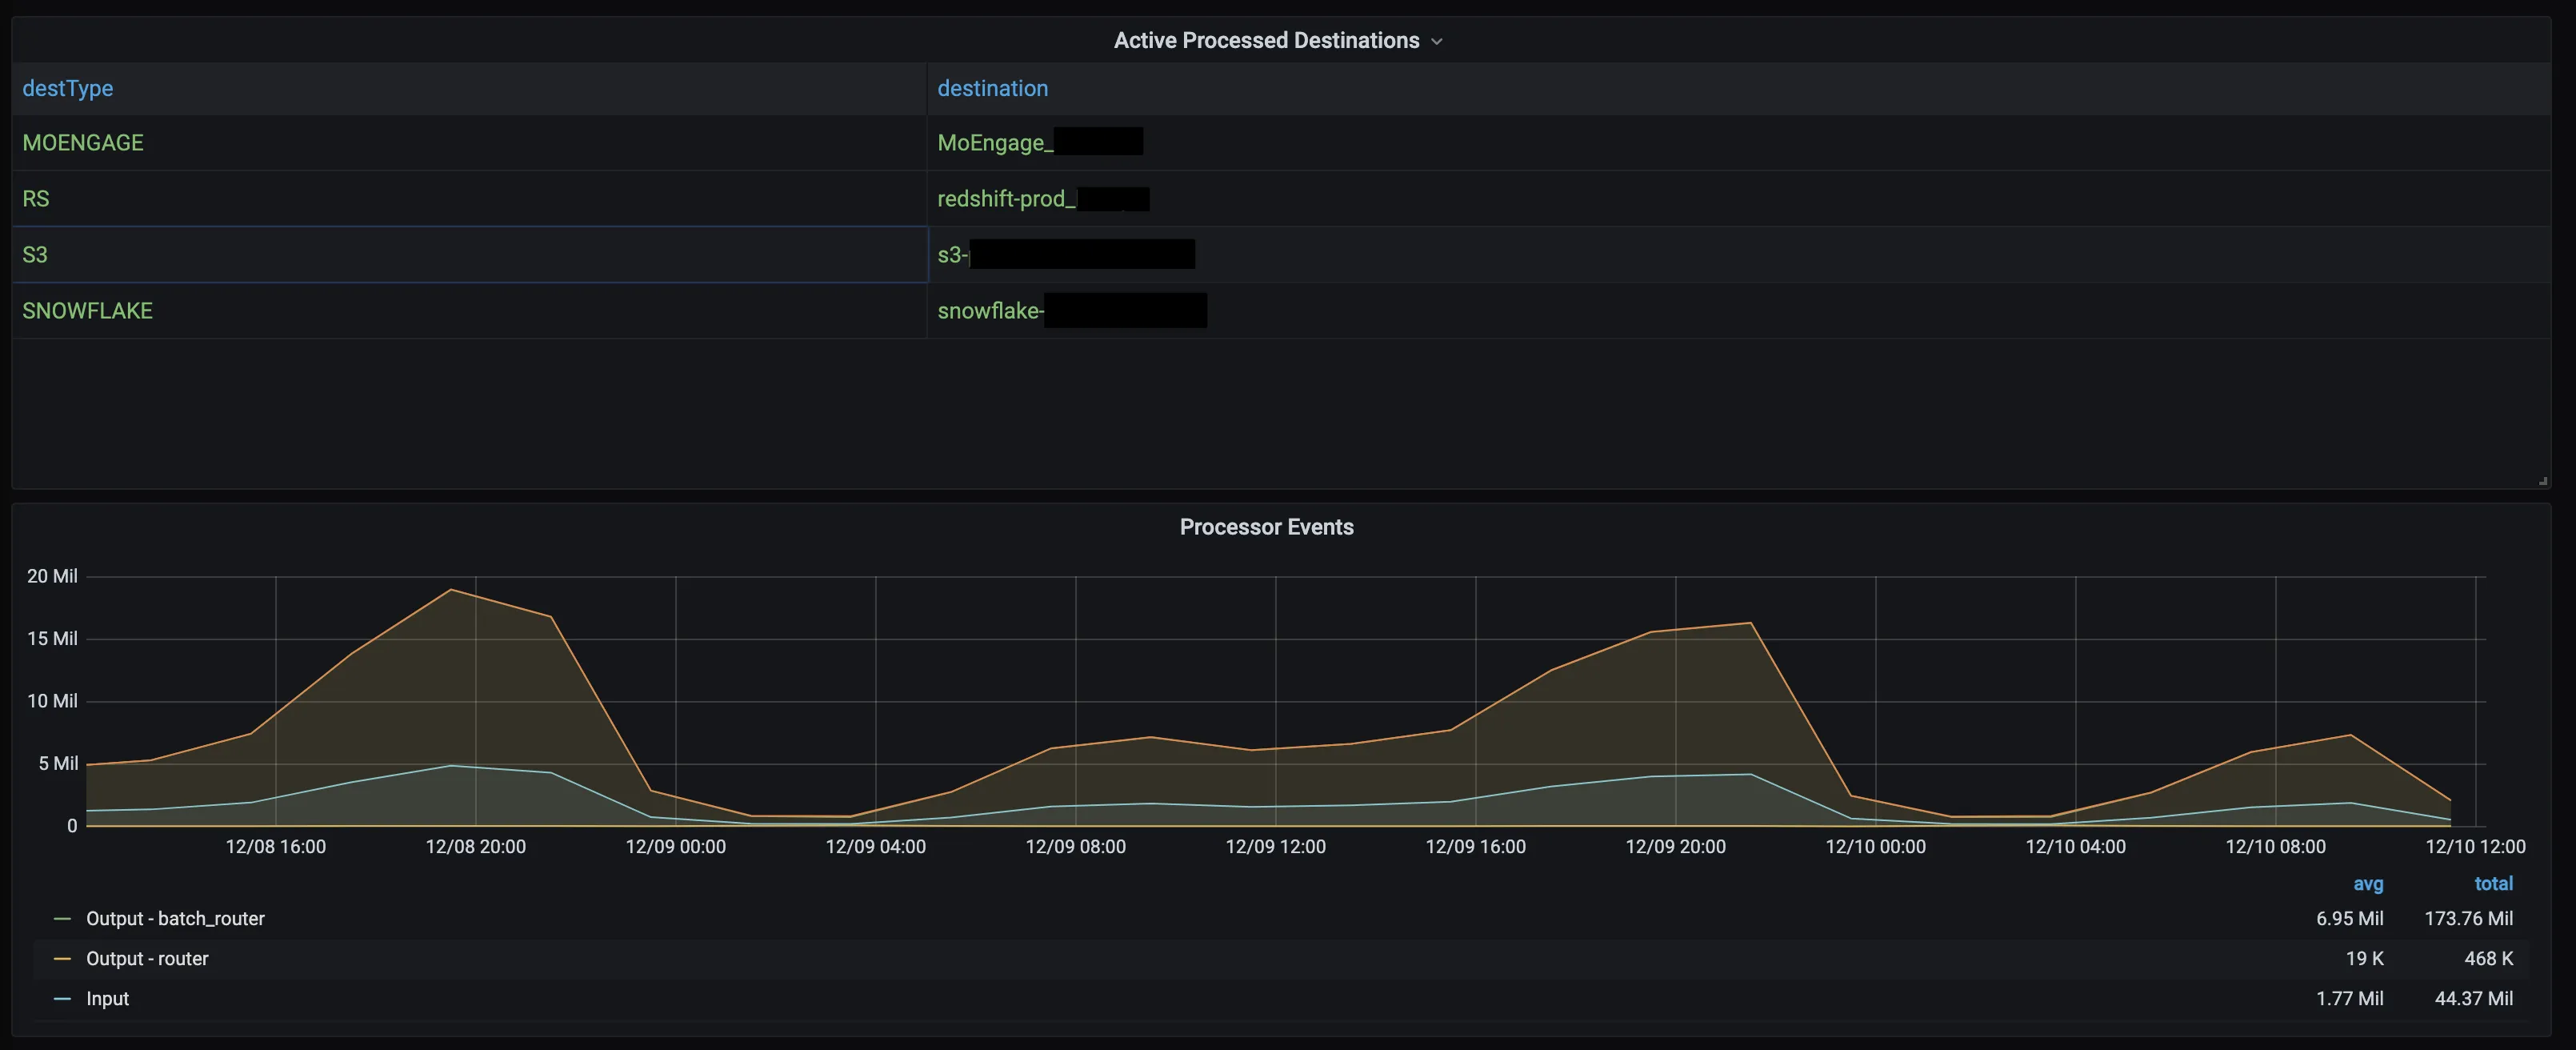
Includes the list of all active destinations within the selected time window. The destination includes first 15 characters of the destination name and last 6 characters of RudderStack’s internal destination ID.
Processor events
This dashboard highlights how input events are multiplexed into destination-specific events.
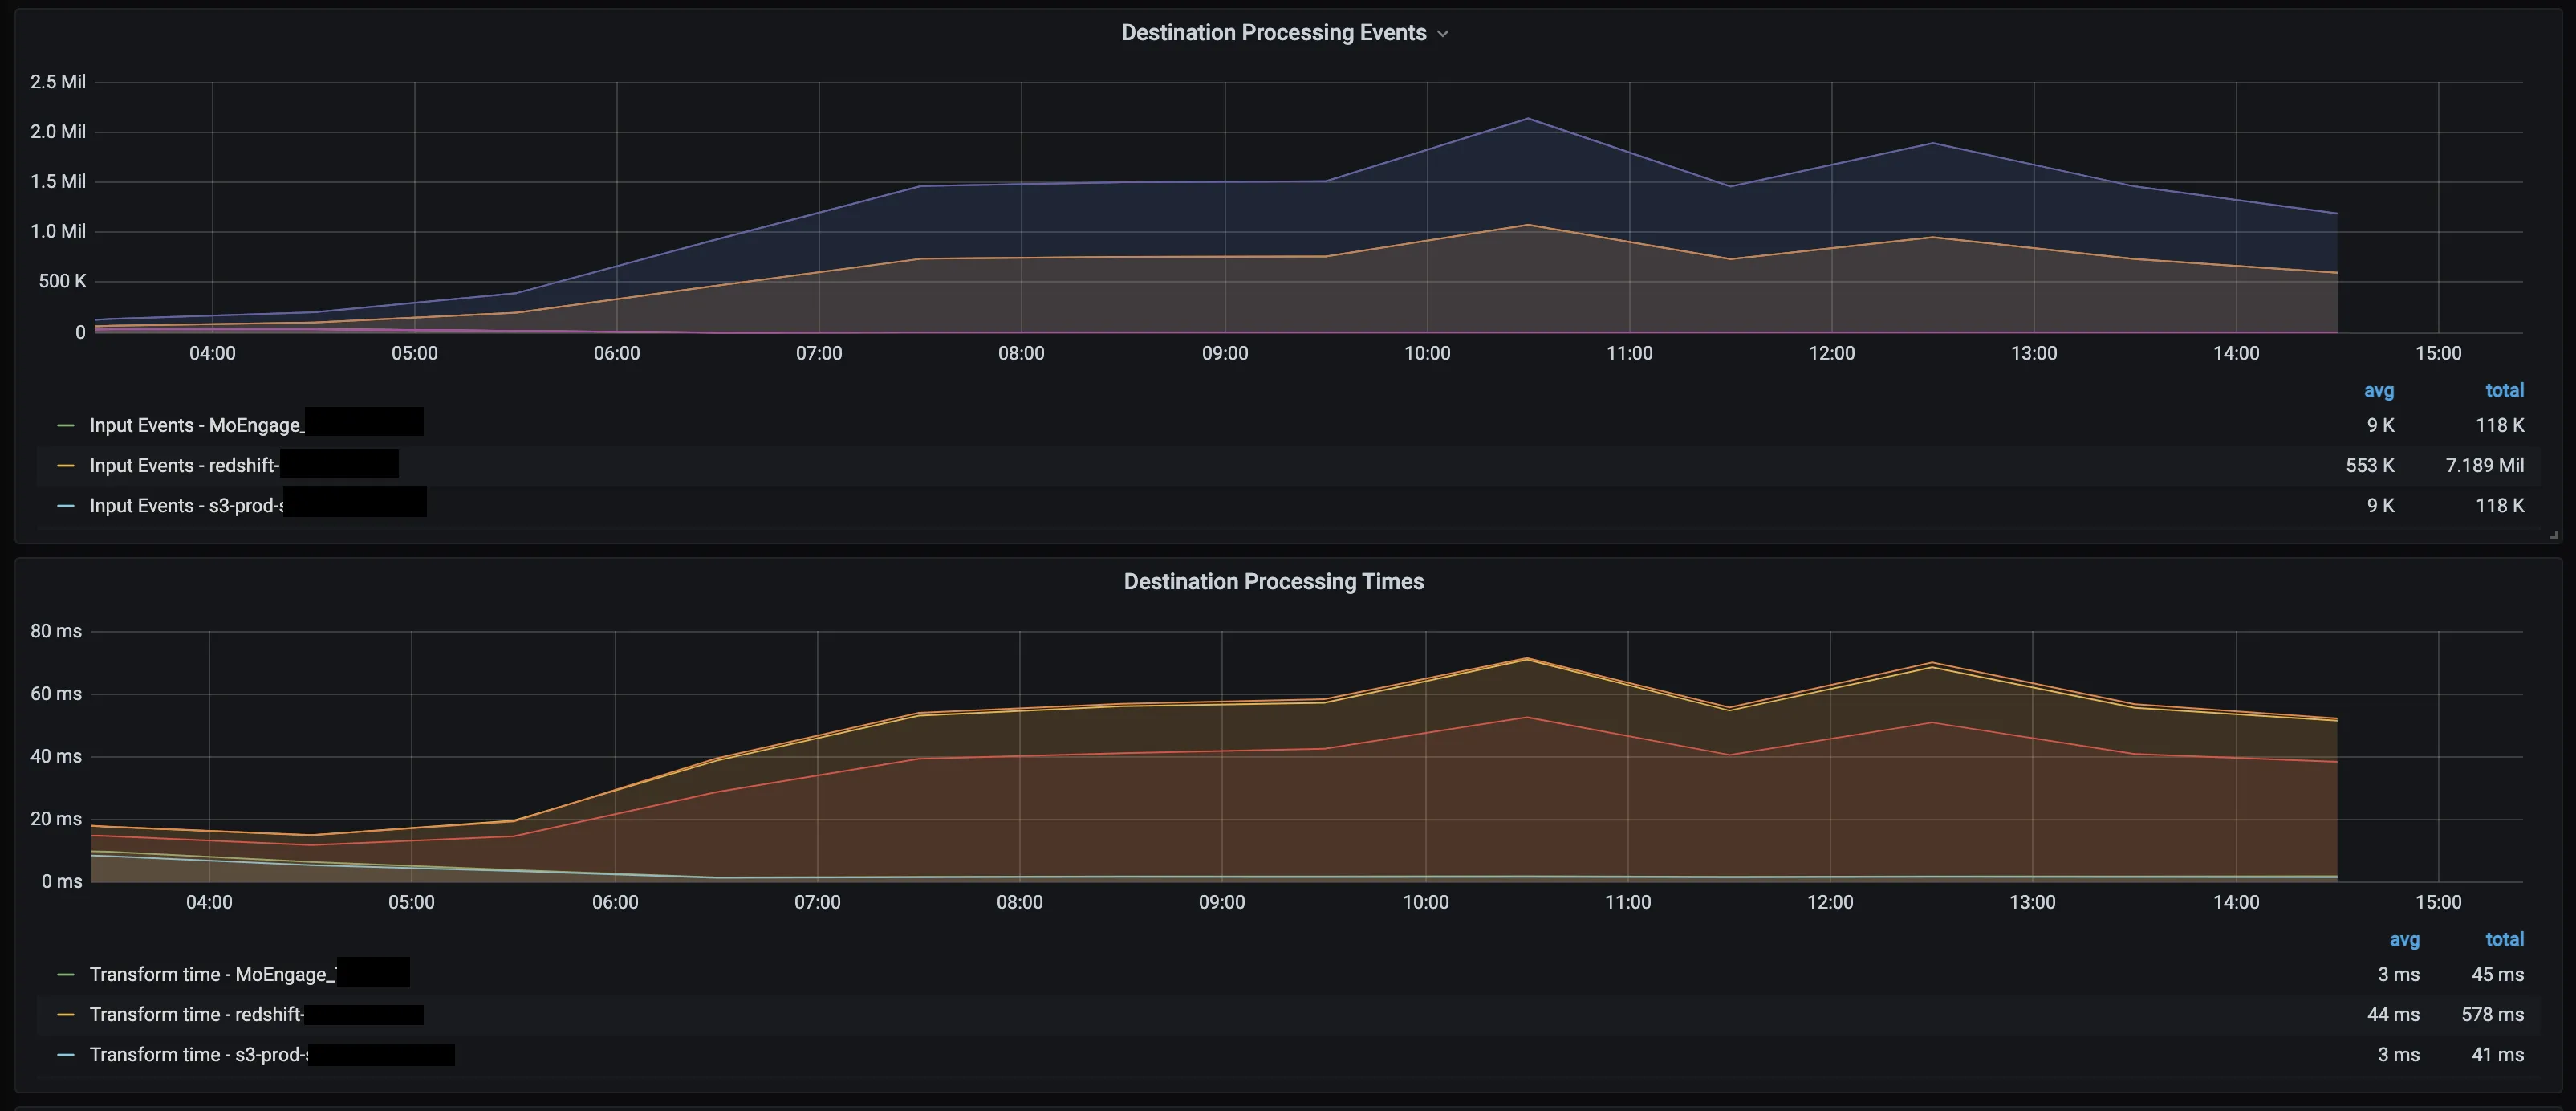
Destination processing events
Number of events generated by the processor per destination.
Destination processing times
Time taken to generate destination events. Note that these events are not sent to the destinations at this stage.
Errors
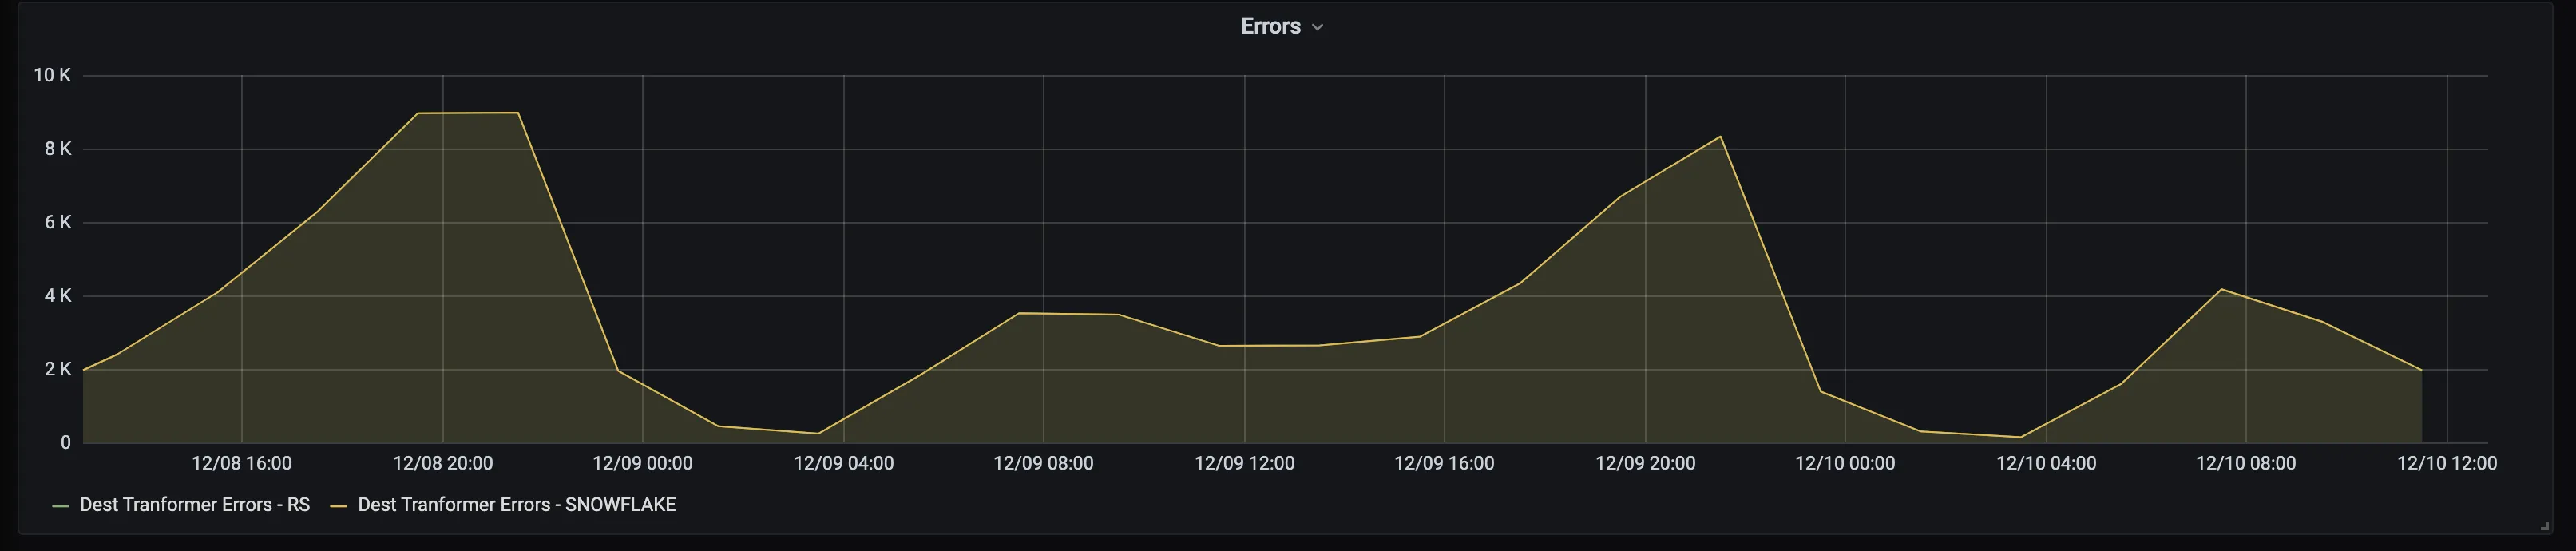
Indicates the number of errors RudderStack encountered during the transformations. Possible reasons are missing mandatory fields for a specific destination, invalid event types, erroneously high number of event properties for warehouse destinations, etc.
Router throughput
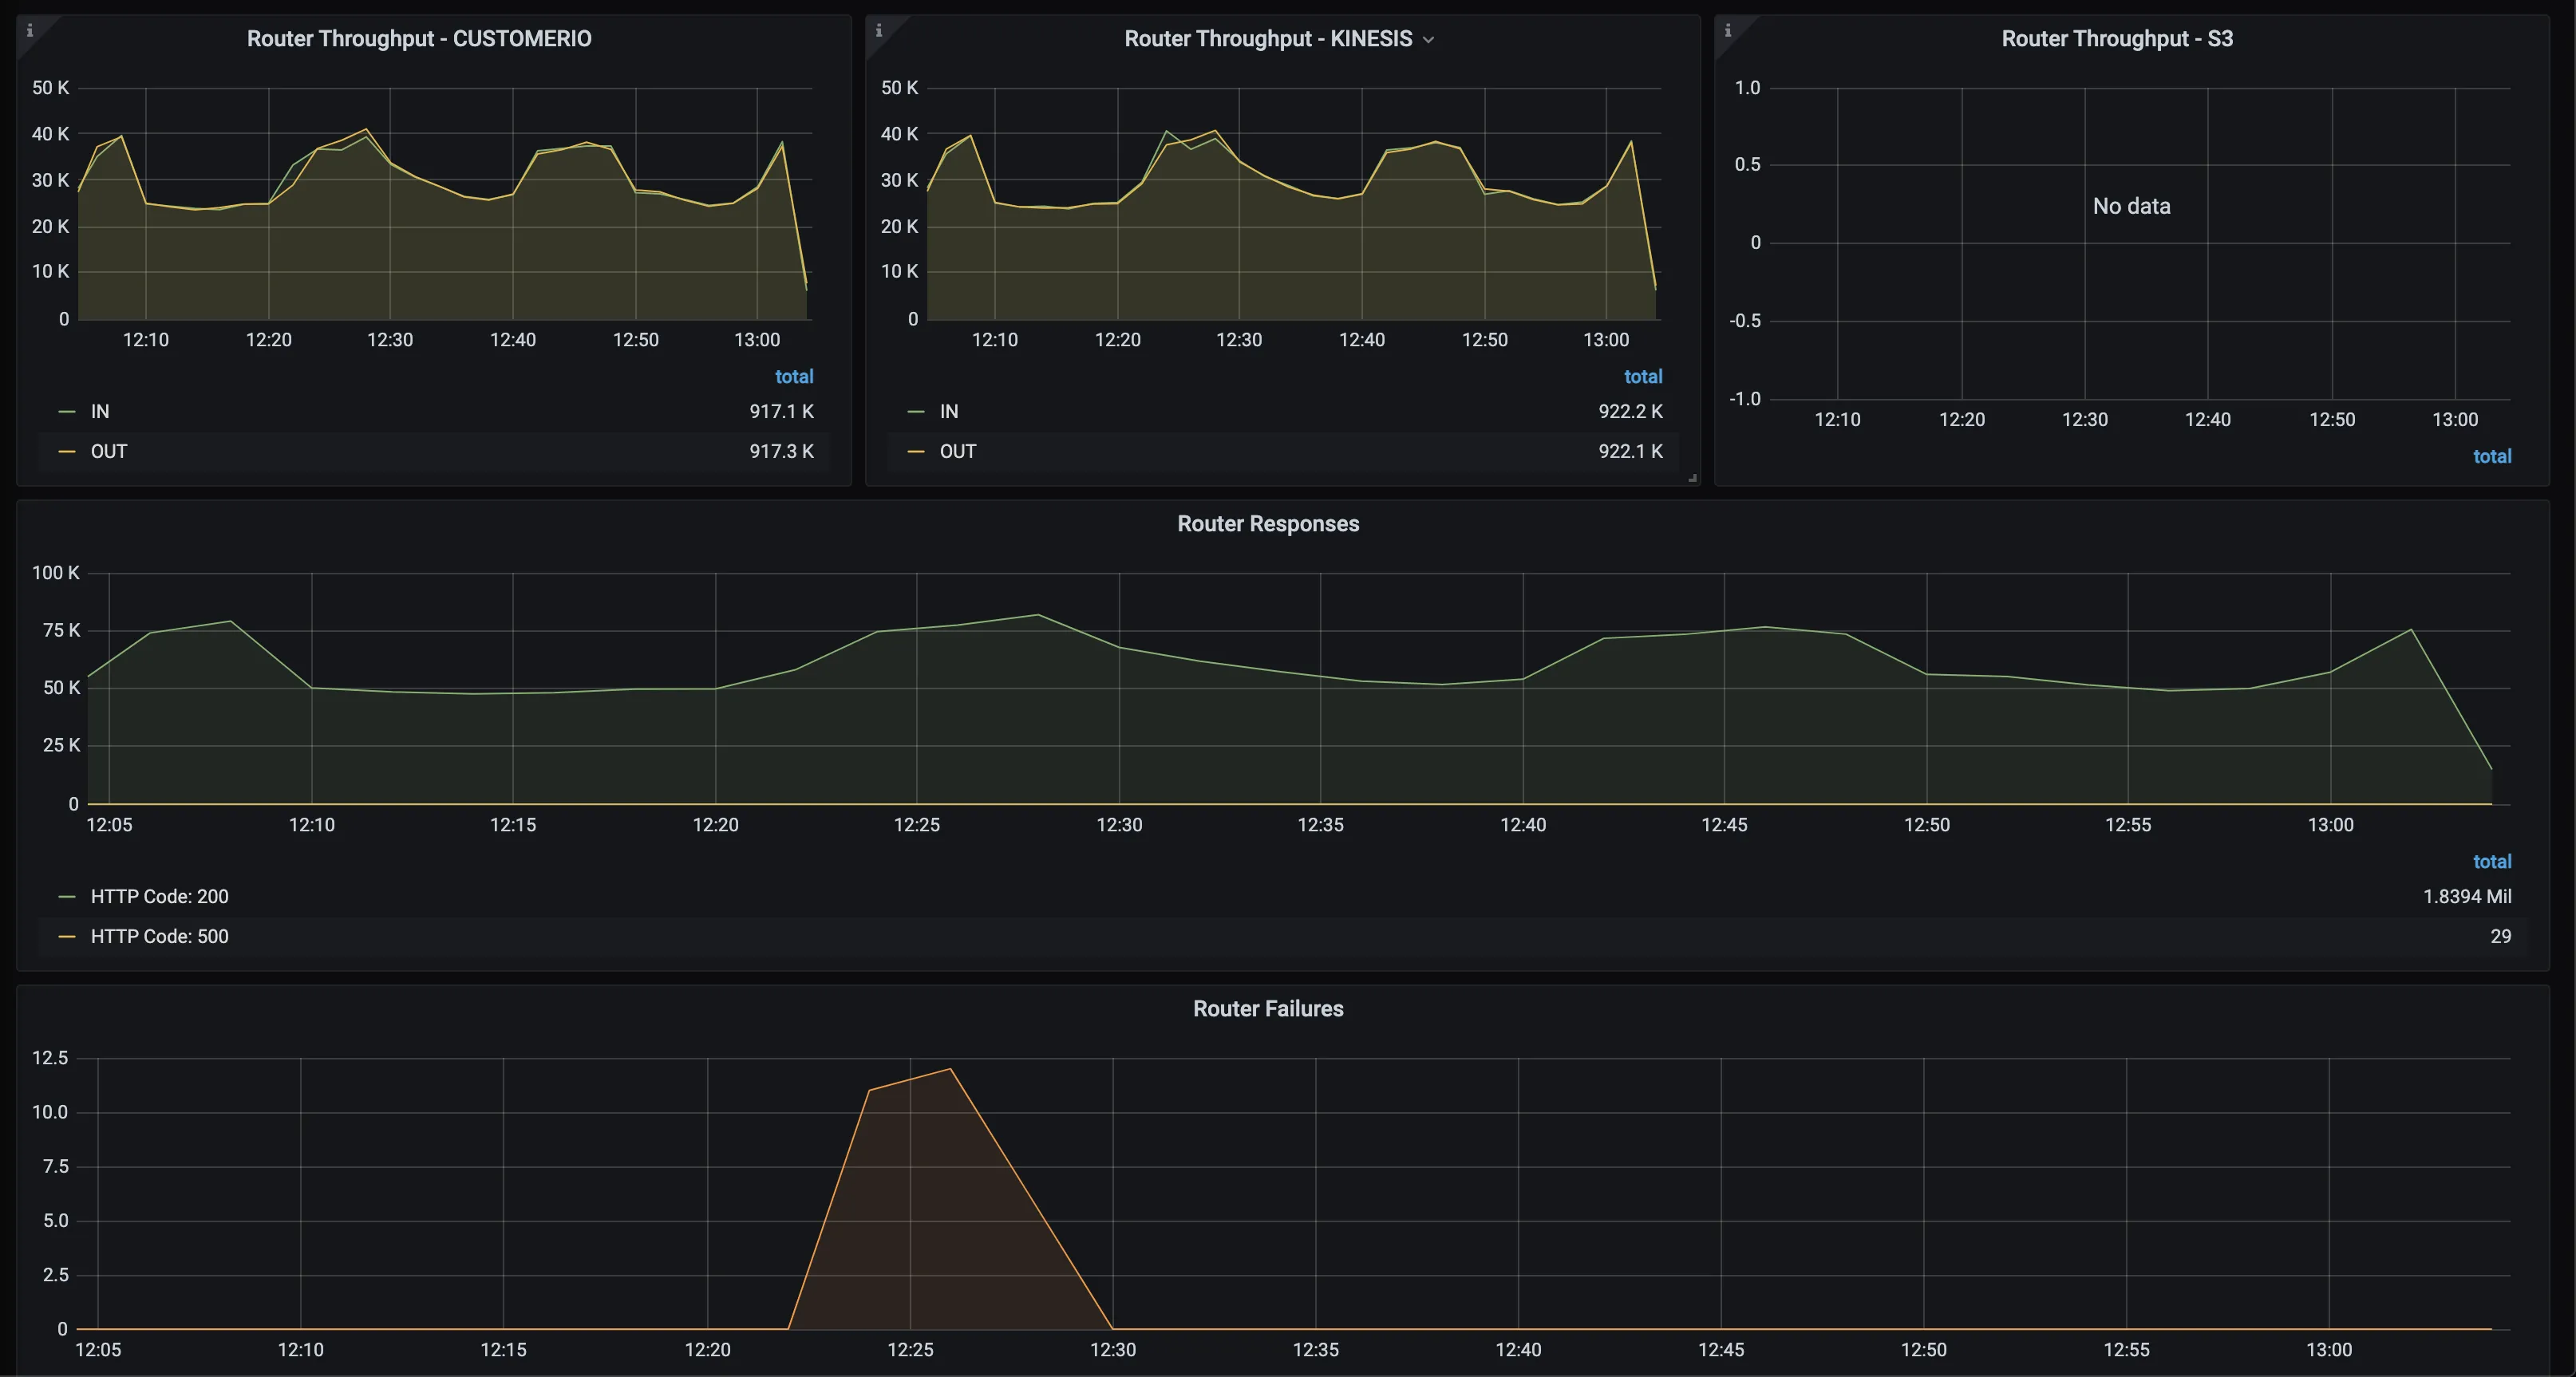
Router throughput - <destination_type>
The router picks the transformed events ready to be sent to the destinations and then forwards them to the destinations. If a destination is down for some time, it retries up to a configured time window (default value being 3 hours). If IN > OUT (refer to the second graph in the image above), there would be a delay in delivering the events. Some possible reasons are a sudden surge of events or that the destination is slow in accepting new event requests.
Router responses
Indicates all destination HTTP responses grouped by status code.
Router failures
Highlights metrics on the failures and retries before the event is delivered. If the event keeps failing even after a configured window, then RudderStack marks it as aborted. The aborted events are also shown in this panel.
Warehouse
RudderStack runs the warehouse uploads as scheduled in the configuration. If there is no defined schedule, it runs the uploads at the default frequency for your plan and the batched data is loaded into the warehouse.
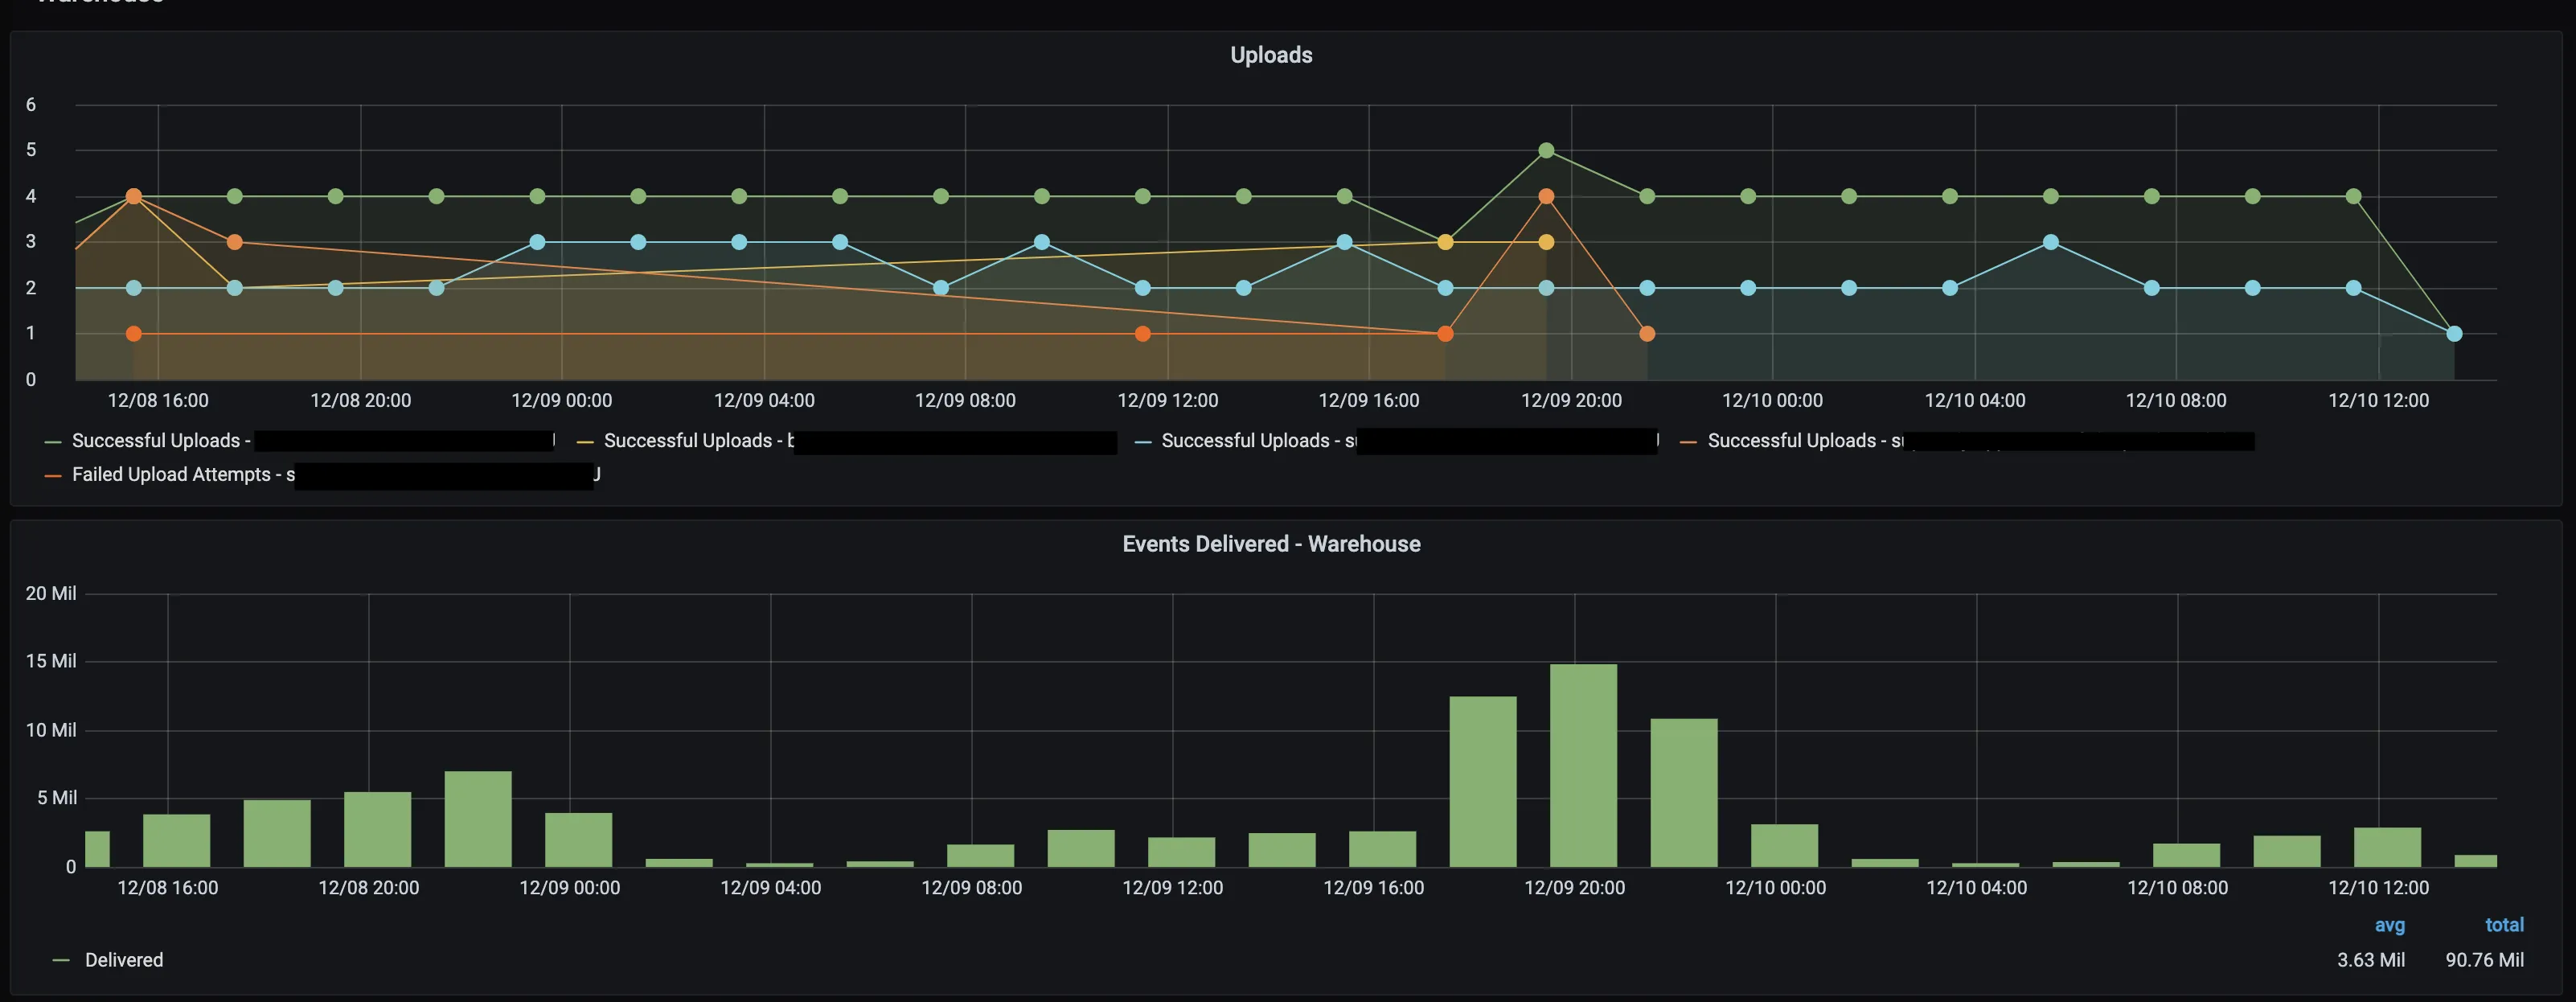
Uploads
The upload status of every batch is shown in the dashboard panel. If an upload keeps failing, RudderStack marks it as aborted after 3 hours. Possible reasons for failure are insufficient warehouse permissions to create and write to tables, reaching column limit on a specific table, warehouse down for maintenance, etc.
Events delivered - warehouse
Number of events delivered to the warehouse destinations plotted against the time when RudderStack completed the upload.
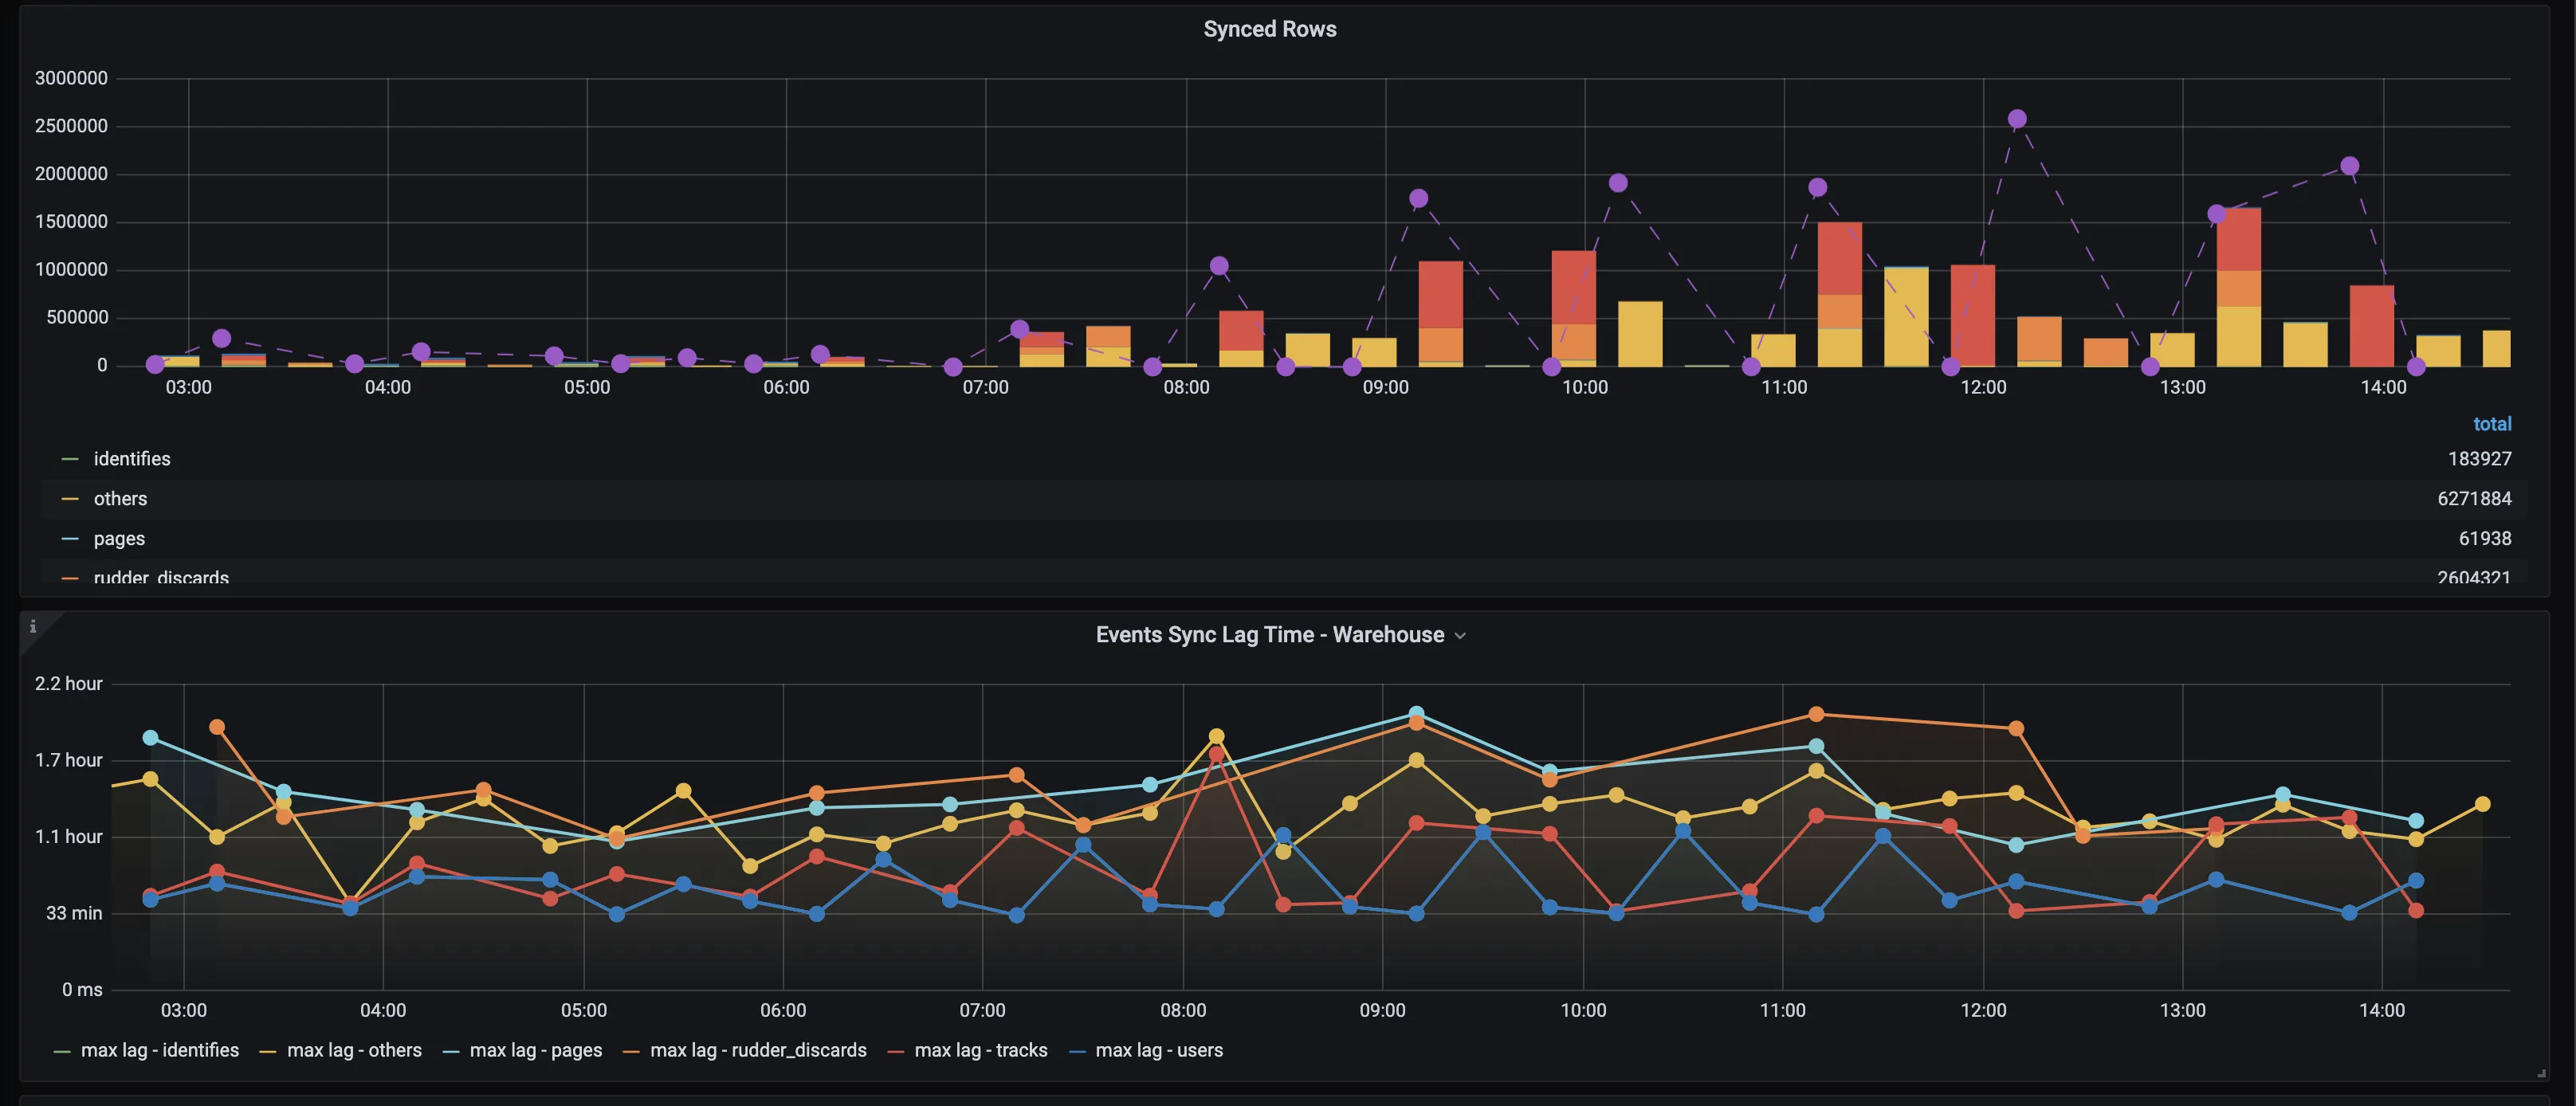
Note that:
- RudderStack syncs a
trackevent name nameduser_logged_into thetracksanduser_logged_intables. See Warehouse schema for more details. Similarly, RudderStack syncs theidentifyevents to theidentifiesanduserstables. Since each event is being synced to two tables, number of synced rows is generally twice the number of events.- If an event property does not match the data type in the corresponding warehouse table, RudderStack does not sync that column into the actual table but moves it to the
rudder_discardstable. See how RudderStack handles data type mismatch for more details.
Synced rows
Number of new rows created in the grouped by table during warehouse uploads. In the example above, if there are different event names (for example, user_logged_in, user_signed_up ) RudderStack groups them all under others in the metrics.
If there are a lot of synced rows in therudder_discardstable, the data type may not be consistent in your sources. It is recommended to check such entries and fix the issue.
Events sync lag time - warehouse
Longest sync delay for delivering events to your warehouse destination — RudderStack batches events at a frequency based on your plan before uploading to your data warehouse, so the delivery takes at least that much batching time. This panel reports the lag for the oldest event in a batch. For example, if the batching period is 30 min and the reported lag time is 50 min, then the average lag time would be 50 - \(30/2\) = 35 min.
JobsDB

JobsDB tables count
Size of the internal queue that RudderStack maintains for routing events. There are three such queues named gateway (gw), router (rt) and batch router (batch_rt).
RudderStack processes events from these queues. If the queue size keeps increasing, it implies that the event outflow is less than inflow.
For real-time deliveries, maintain queue size at 1 or 2.
Set up alerts in Grafana
You can use the Grafana dashboard to set up time-critical alerts for various use cases like:
- Aborted/failed events to destinations
- Event volume spikes crossing a defined threshold.
The following video tutorial walks you through setting up and enabling alerts in your Grafana dashboard:
