Live Events
5 minute read
RudderStack’s Live Events feature gives you a near real-time view of the events flowing from your sources to the connected destinations. You can use this feature for better observability into your events and debug errors in case of any event failures at the destination level.
You can use this utility to view the following three types of events:
| Live events type | Description |
|---|---|
| Source live events | View source events collected by RudderStack |
| Destination live events | View events sent to the destination |
| Transformation live events | View transformed events |
Because Live Events can include sensitive event payloads, the data is stored and served from the same region as your data plane — it does not cross regional boundaries.
Required permissions
Admins have full access to live events for sources, destinations, and transformations.
Members must have the following permissions in their workspace policy to view the live events:
| PII permission | Description |
|---|---|
| Source Live Events | View live events for a source |
| Destination Live Events | View live events for a destination |
| Transformation Live Events | View live events flowing through a transformation |
To view live events ingested by Reverse ETL sources, they must have the following permissions:
| PII permission | Description |
|---|---|
| Table Live Events | View live events from a Reverse ETL source created via a warehouse table |
| Audience Live Events | View live events from a Reverse ETL source created via an audience |
| SQL Model Live Events | View live events from a Reverse ETL source created via a SQL model |
Source live events
This feature gives you visibility into the source events collected by RudderStack — it is helpful when you want to verify if your source is correctly configured.
View source live events
- Go to the source for which you want to view the live events.
- Click the Live events button.
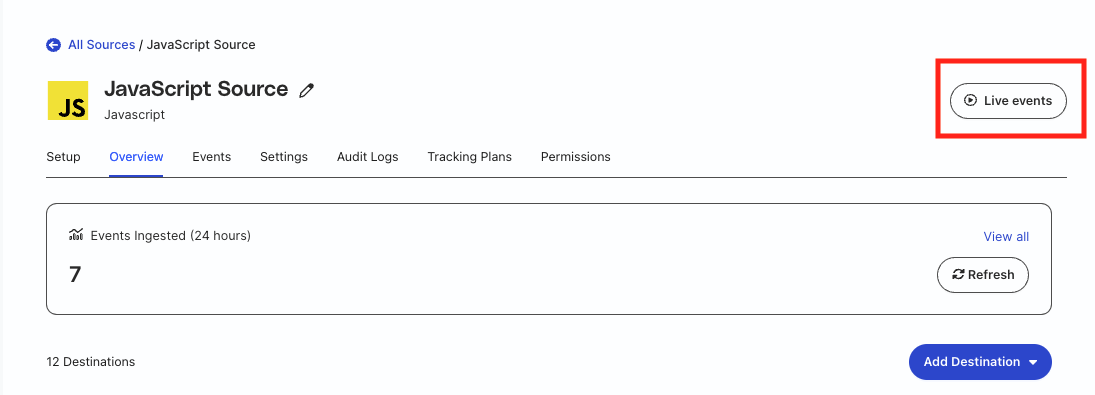
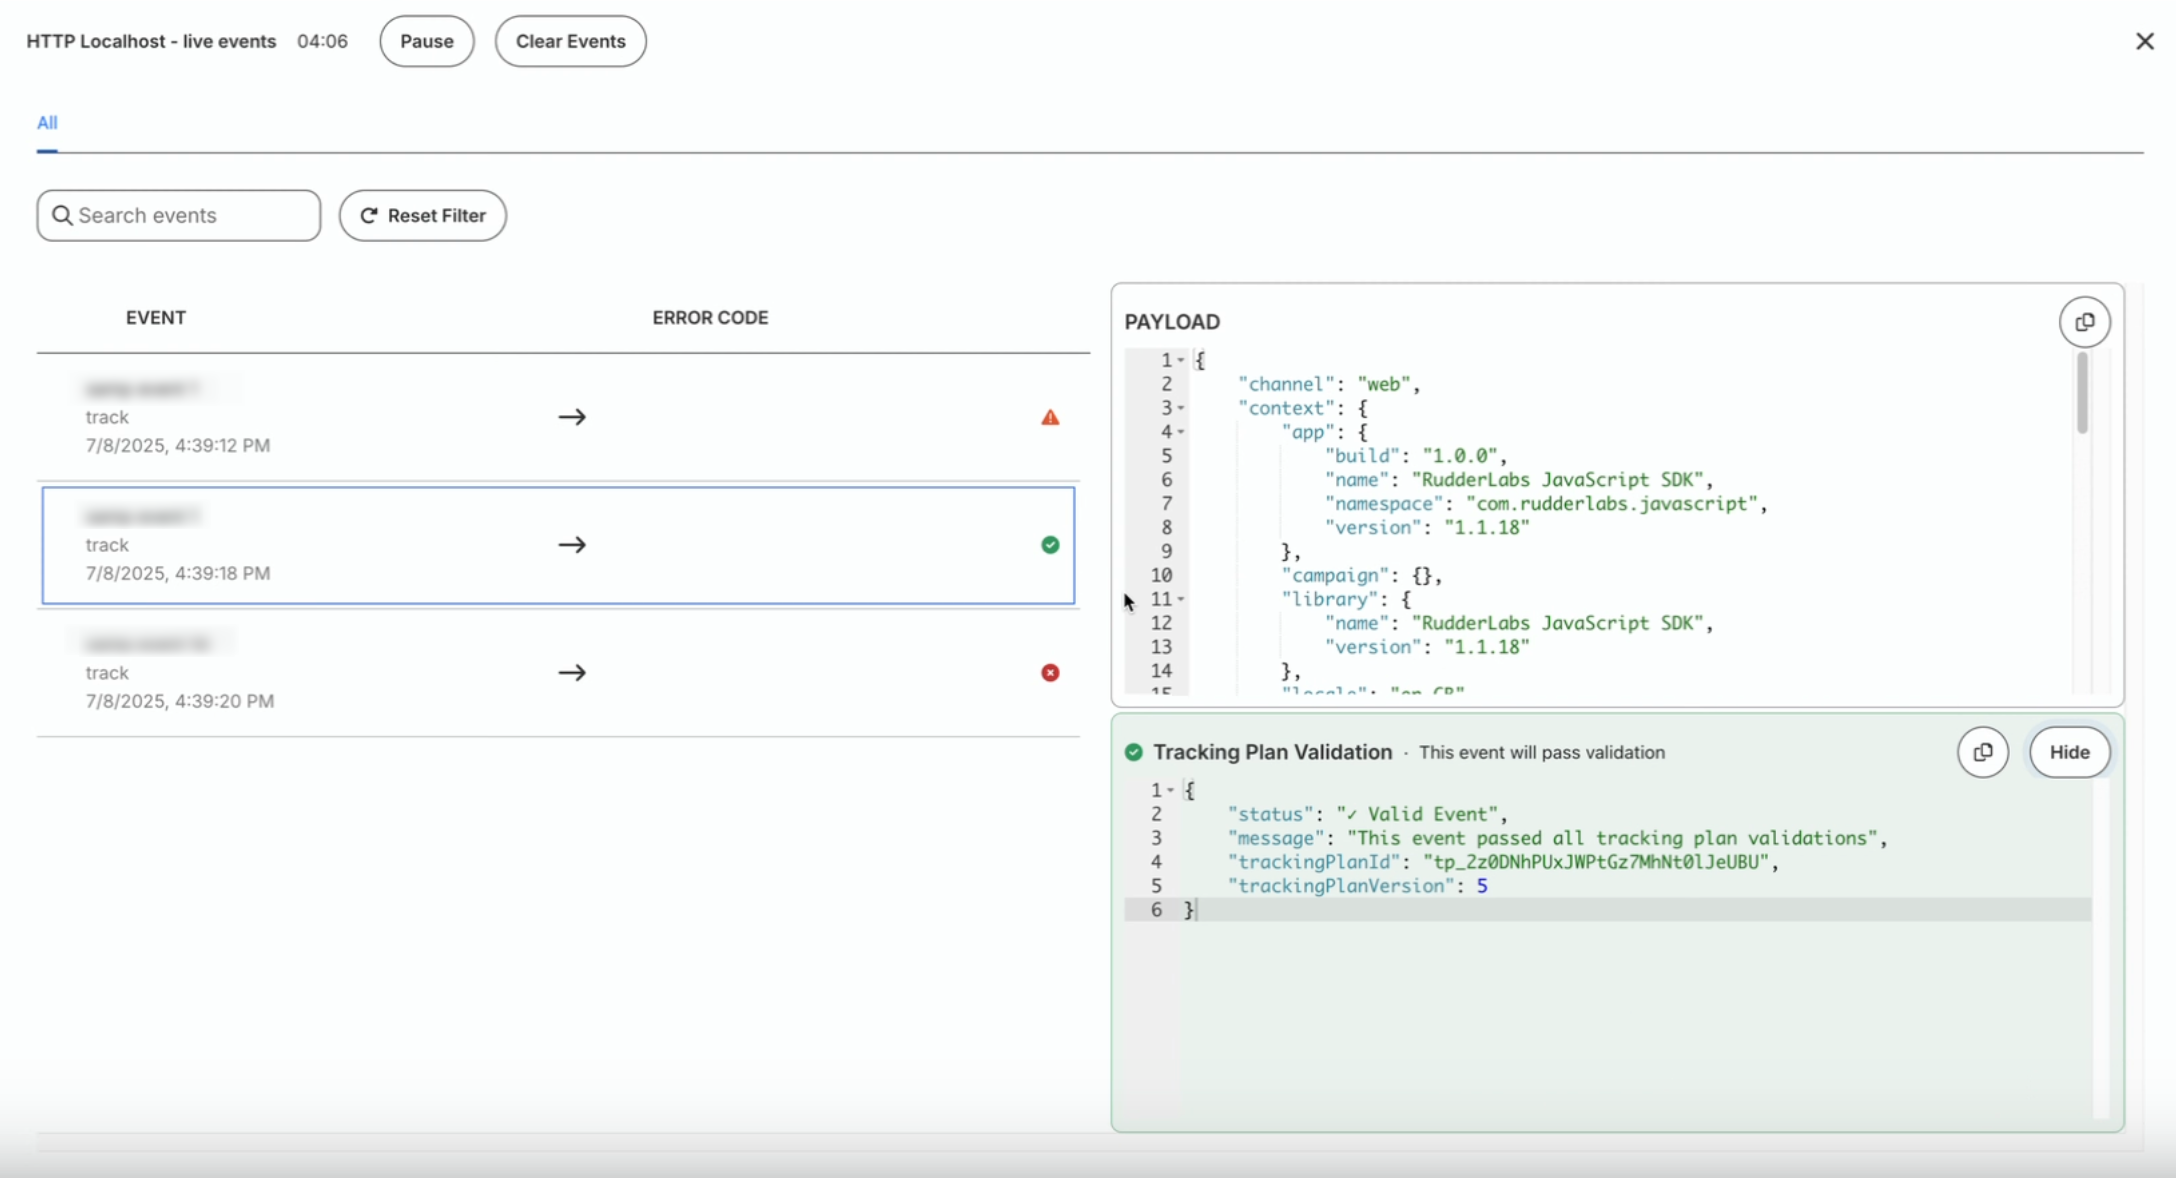
Once you send the event data from the source to RudderStack, you will see the following details in this view:
- Name of the event
- Type of the event collected from the source
- Date and Time of the collected event
- The Payload panel containing the event payload
- The Tracking Plan Validation panel on the bottom right, just below the Payload panel.
Destination live events
The destination live events view gives you visibility into your destination’s responses.
When routing events to a destination, there can be instances when the events do not show up in the destination — in such cases, the error message included in this view is helpful for debugging.
View destination live events
You can view live events for cloud mode destinations only .
Go to the destination for which you want to view the live events.
Click the Live events button.
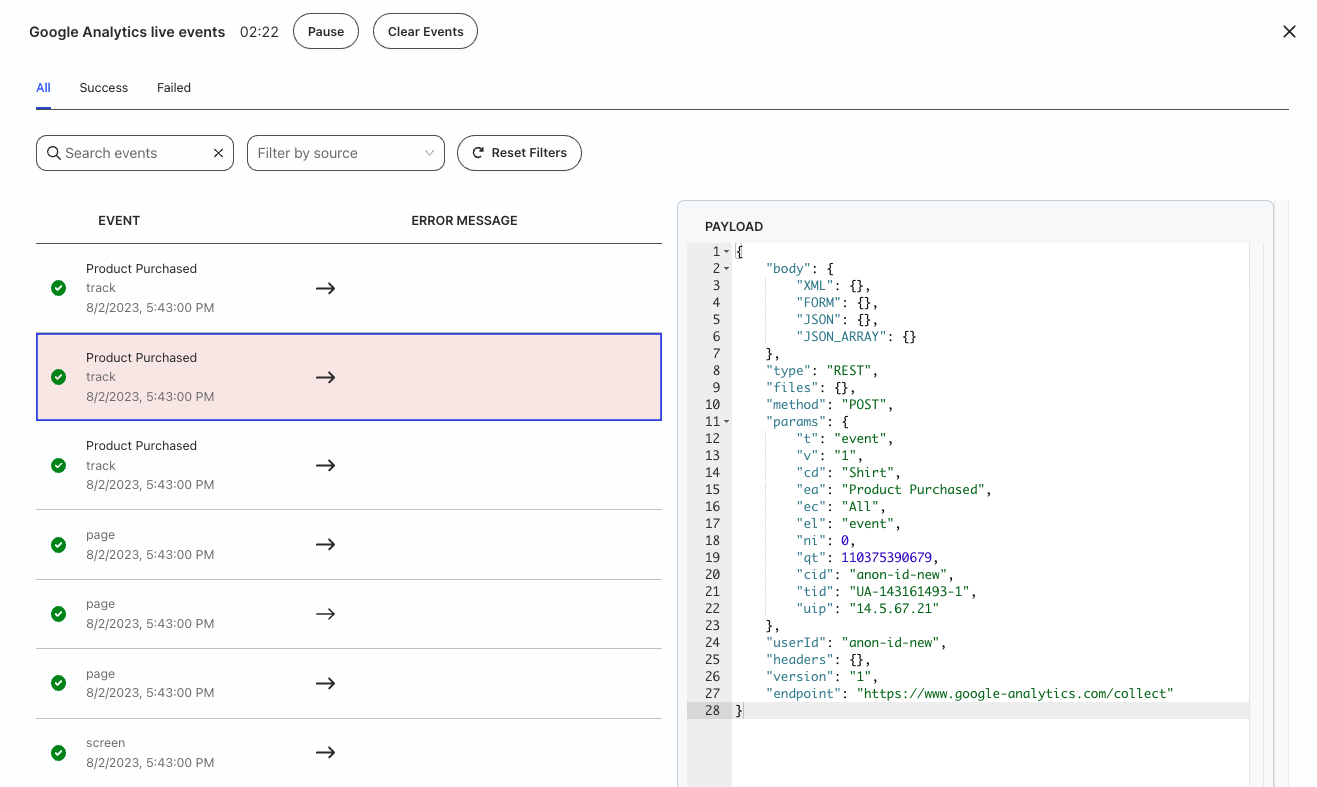
Once you send the events from your source to the destination, you will see the following details in this view:
- Name of the event
- Type of the event
- Date and Time of the event
- Error message of the event in case of event failure — it gives specific details related to an error including the error response and the date and time of the attempt made to send the event.
- The Payload panel containing the event payload sent to the destination.
Note that:
- Live events are shown for all destinations except some destination types like object storage platforms, for example, Amazon S3, Google Cloud Storage, Azure Blob Storage, etc.
- You can use this view to filter events by source if your destination is connected to multiple sources.
Use case
Suppose that you send some events to Facebook Custom Audience but they are not delivered. On checking the Live Events tab for the Facebook Custom Audience destination, you see the following error:
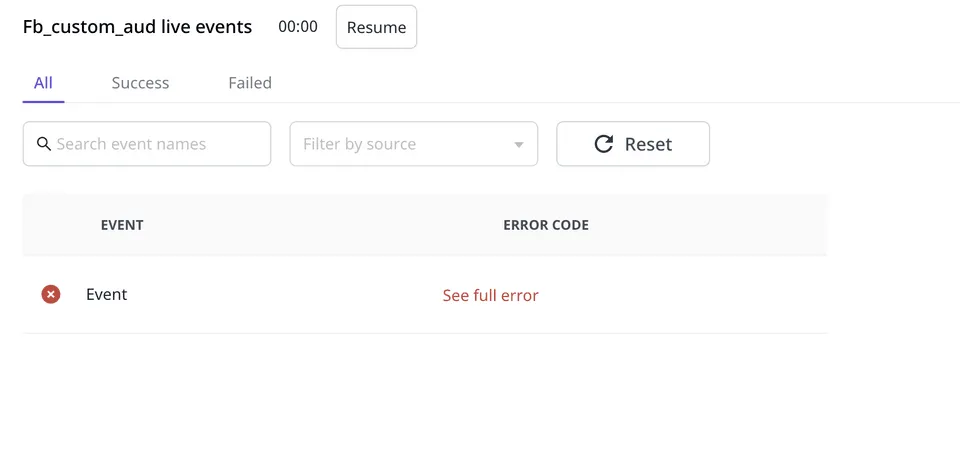
Clicking on See full error option displays the following error response:
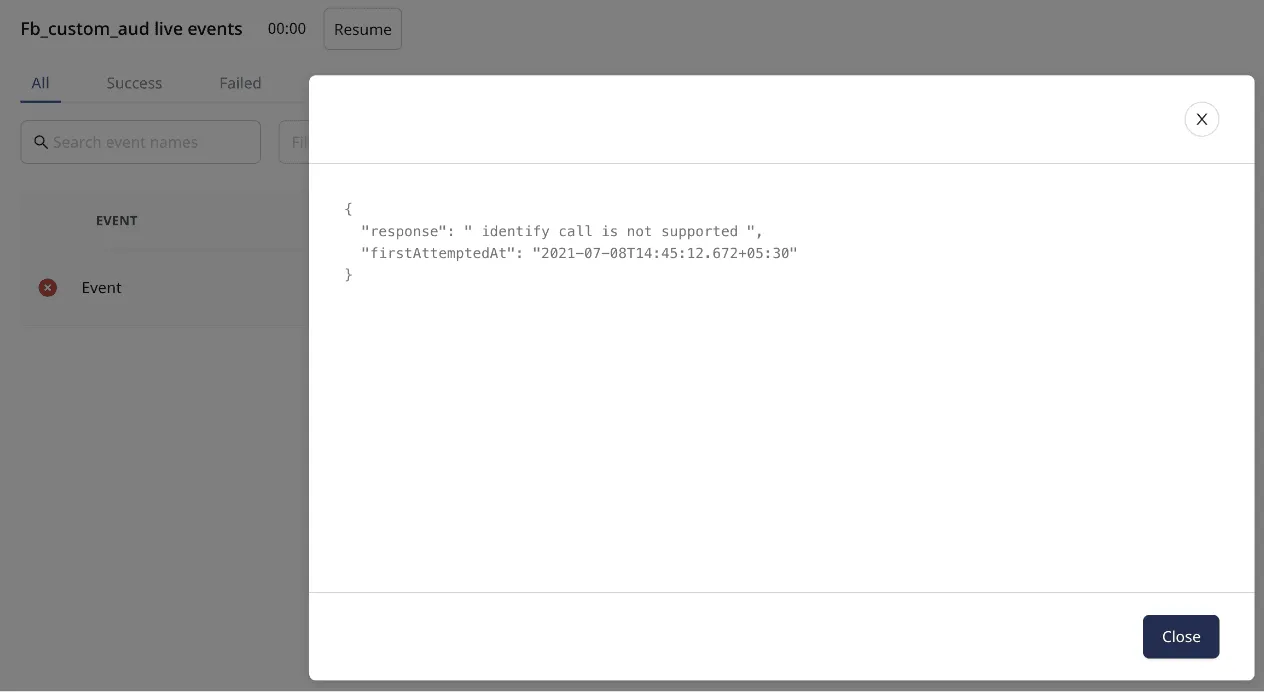
Facebok Custom Audience supports only record type of events. As seen above, an identify event is sent instead and hence you see the error.
RudderStack tries sending this event several times before marking it as aborted.
Transformations live events
You can also view the live events in case a transformation is connected to a destination. RudderStack lets you view the events before and after a transformation is applied:
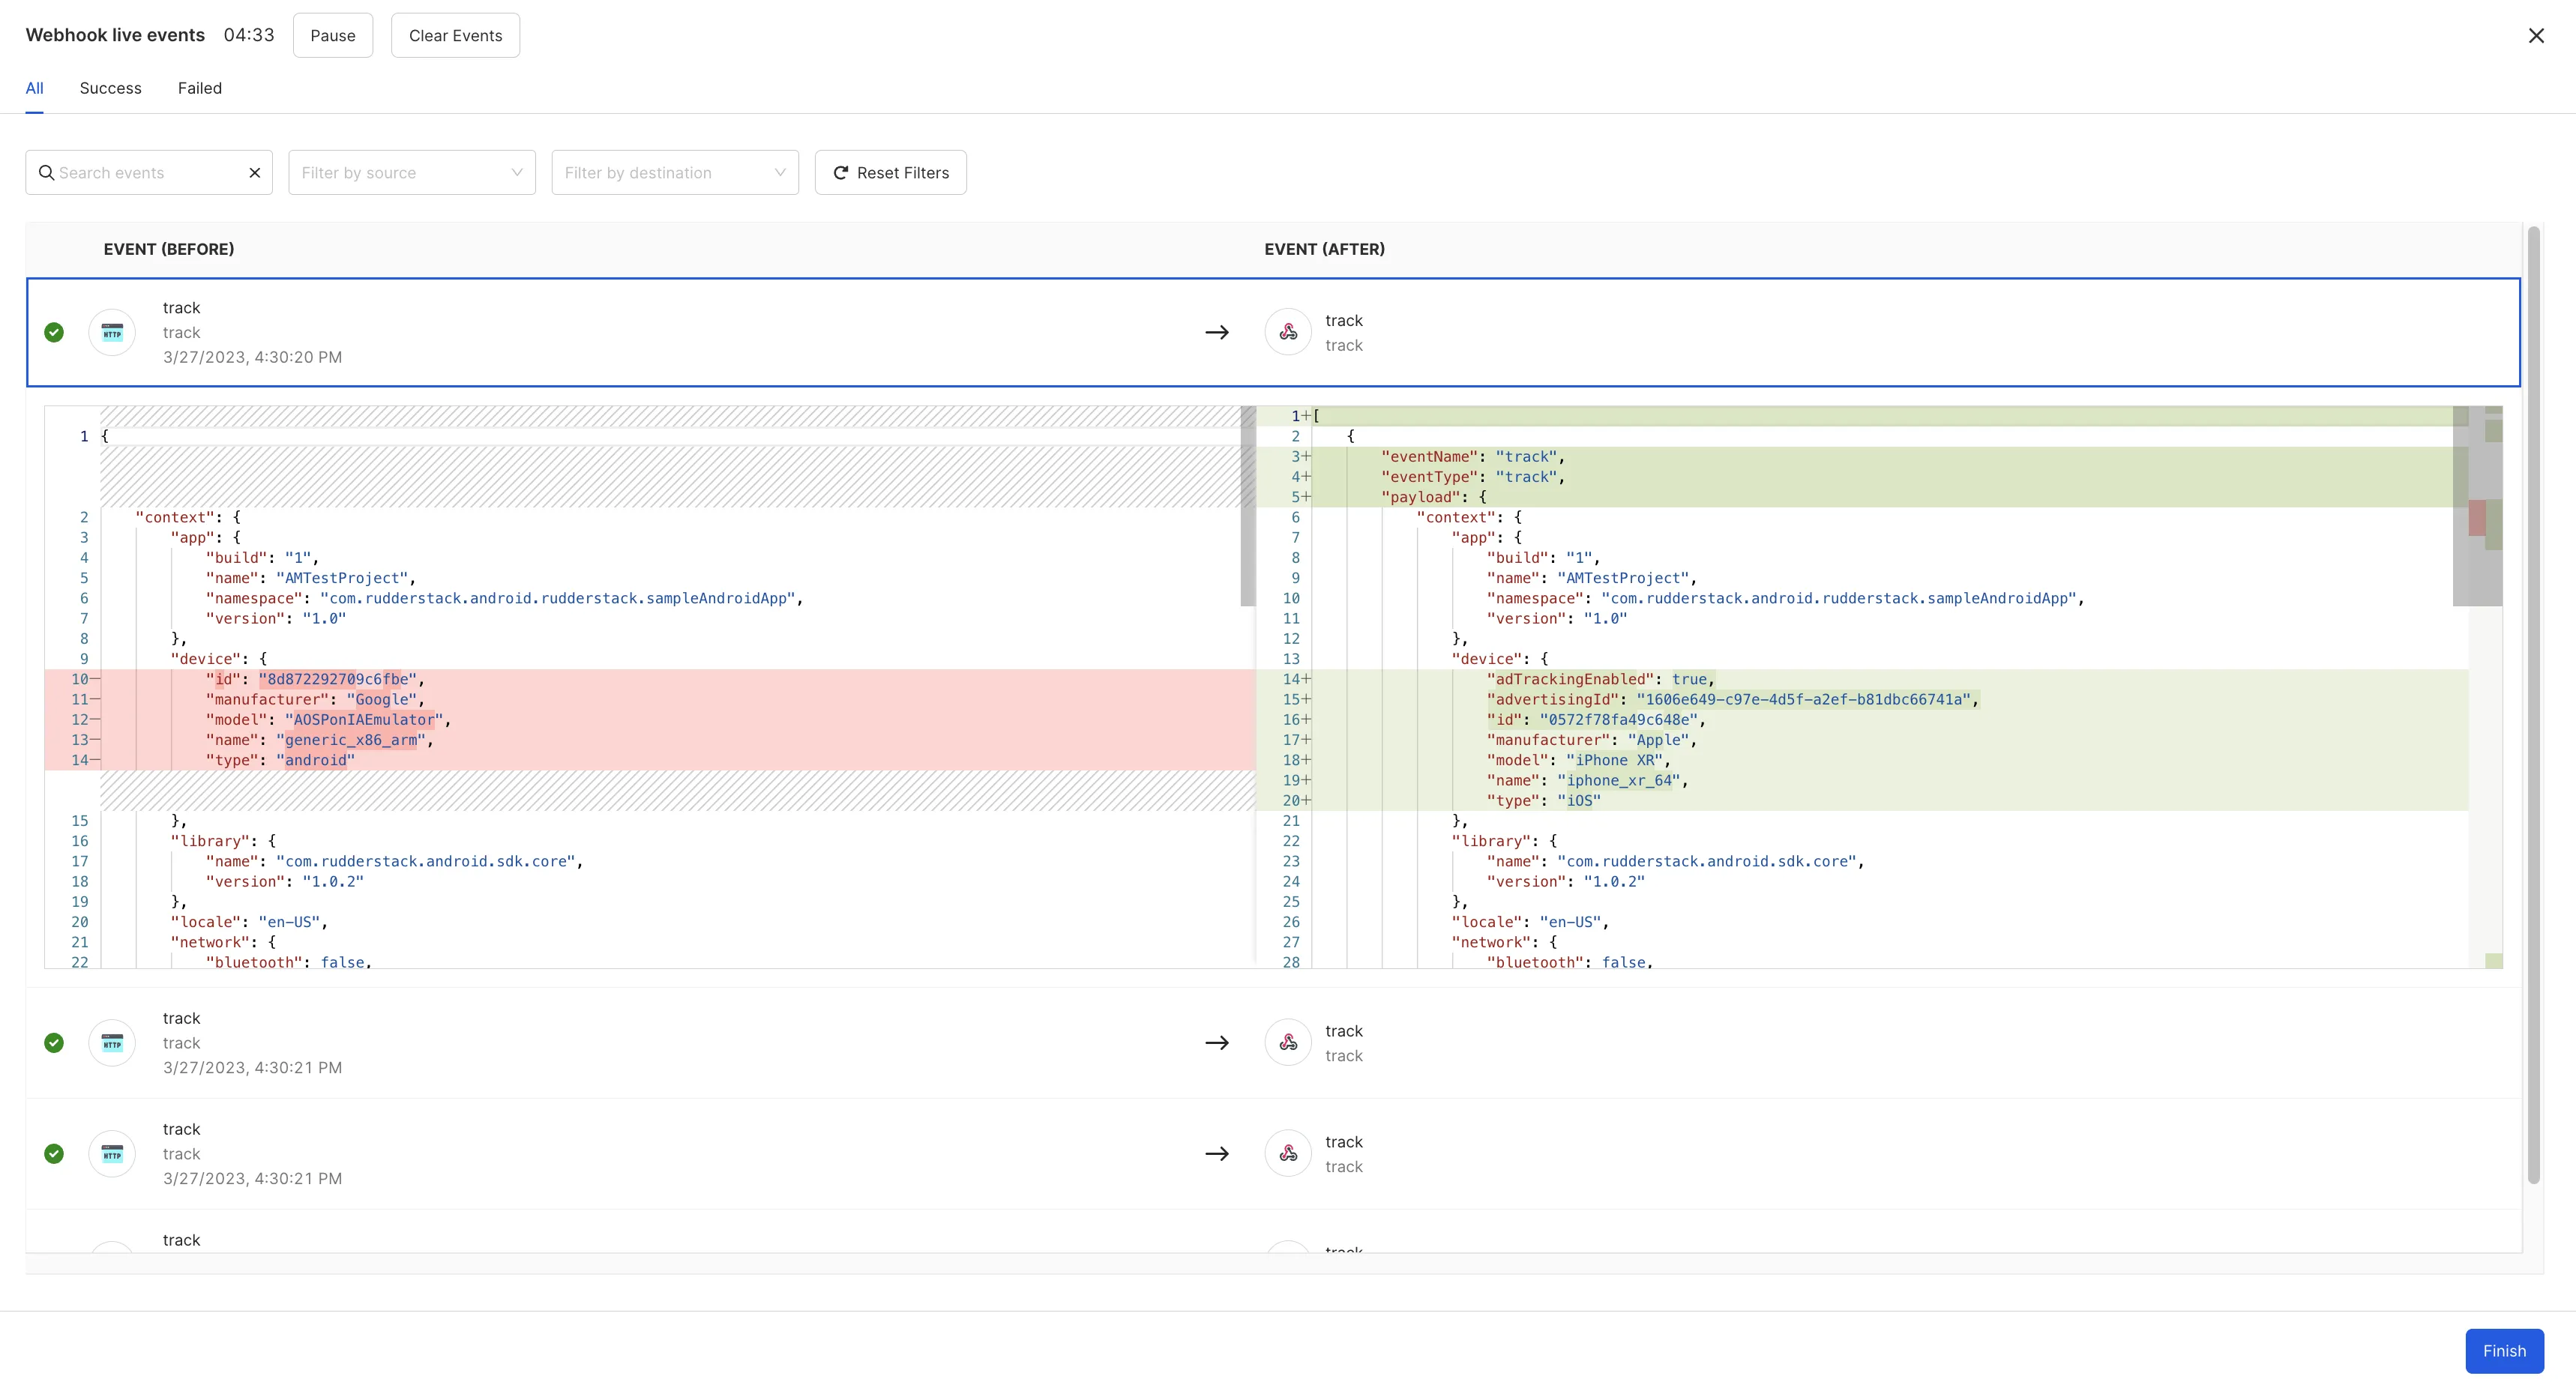
RudderStack also notifies you about any dropped events or errors during the transformation along with the details:
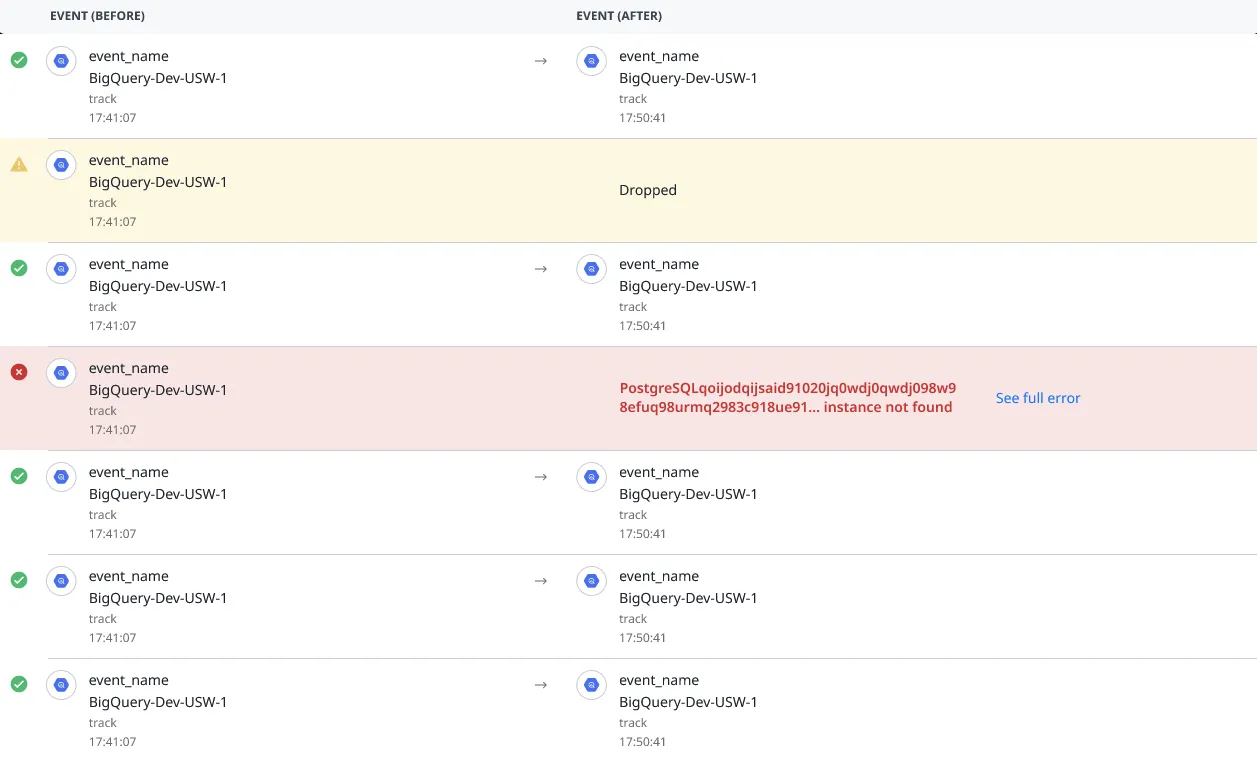
If you keep a transformation event row expanded while inspecting it, newer transformed events are buffered and surfaced through the in-product refresh prompt instead of being appended immediately.
Important considerations
- A live session stays active for about 15 minutes after you open it.
- New events appear on a short polling cadence (typically every few seconds), so updates are not instant.
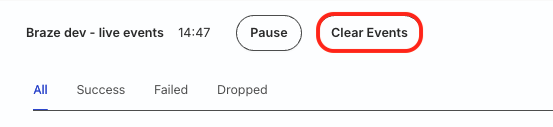
- Only a fixed set of events is visible at a time — the viewer does not auto-scroll. Click the Clear Events button to load the next set of incoming events.
FAQ
Why are the events sent to the destination failing?
Routing events to a destination can fail for various reasons. Often, it is due to the incorrect configuration of a destination in the RudderStack dashboard. Some other possible reasons are:
- Incorrect/bad event payload structure
- Rate-limiting by the destination
- Network error
- Destination downtime
The Destination Live Events feature gives you better visibility into how your events are sent to the destination. If there are any delivery failures, the utility also gives you insights into the reasons for the failure.
Are live events supported for device mode destinations?
RudderStack does not support the live events functionality for device mode destinations, that is, destinations configured to receive events in device mode.
You can view live events for cloud mode destinations only.
Are Live Events served from the same region as the data plane?
Yes. Because Live Events can include sensitive event payloads, the data is stored and served from the same region as your data plane — it does not cross regional boundaries.
