Health Dashboard
- free
- growth
- enterprise
7 minute read
RudderStack’s Health dashboard provides an intuitive UI to monitor all your Event Stream and Reverse ETL pipelines. It also provides realtime observability metrics for the tracking plans linked to your sources, including validation errors, violation types, etc.
To access this dashboard, log in to your RudderStack account and go to Monitor > Health in the left navigation bar.
Overview
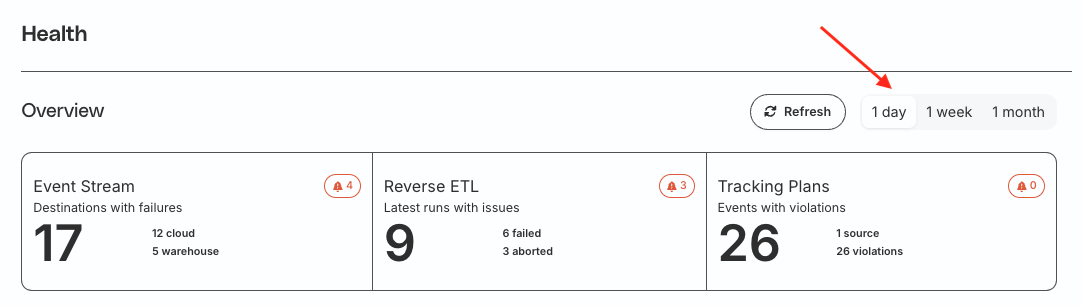
In the Overview section, you get a quick summary of the following:
- Number of destinations with failures across your Event Stream pipelines, including cloud and warehouse destinations.
- Number of Reverse ETL connections facing issues related to sync runs.
- Number of event violations for all the tracking plans linked to your sources.
You can filter these metrics by period - one day, one week, or one month - depending on your requirement.
Active alerts
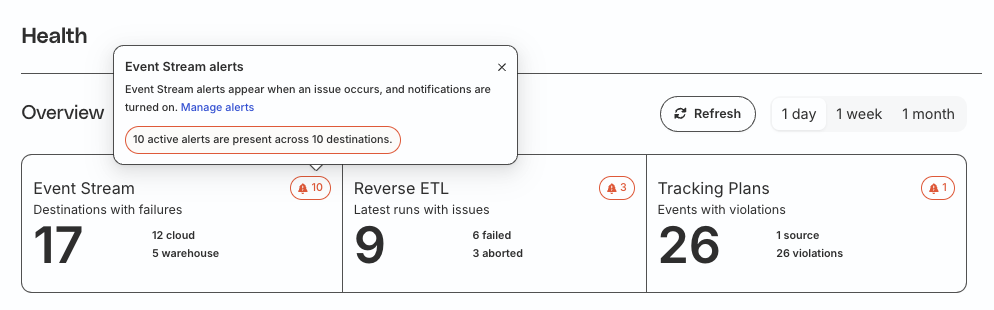
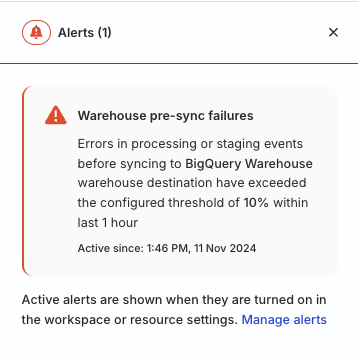
In the Overview section of the Health dashboard, you also see the active alerts (symbolized by the bell icon) - these are unresolved alerts that RudderStack triggered (based on the thresholds set by the customers at the workspace or resource level).
Note that the number next to the bell icon signifies the number of resources across which active alerts are present:
- For Event Stream, it denotes the number of destinations.
- For Reverse ETL, it denotes the number of connections.
- For Tracking Plans, it denotes the number of sources.
To view the active alerts:
- Click the bell icon next to the resource.
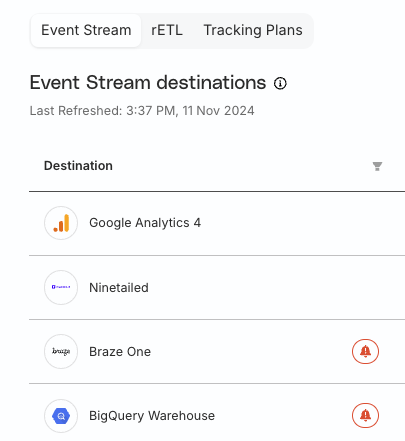
- From the resulting pane, go to that resource via the View destination or View source button.
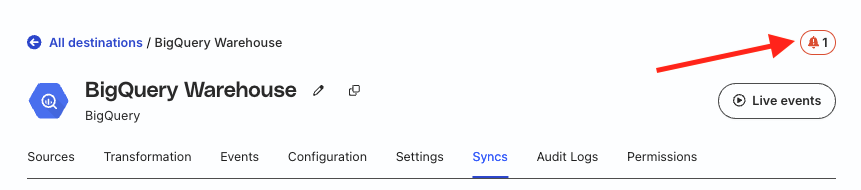
- Click the bell icon on the top right of the resource page to view the alert.
Event Stream
The health dashboard shows event delivery and failure metrics for cloud mode connections only. It does not include data for the device mode connections.
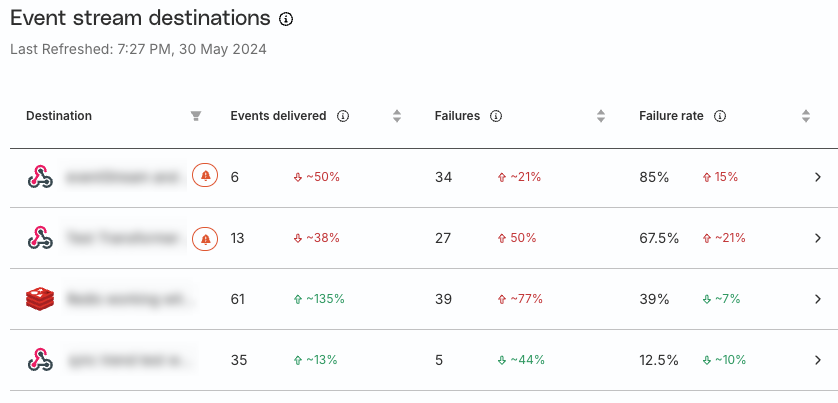
In this view, you get a list of all the Event Stream destinations in your workspace with the following details:
| Metric | Description |
|---|---|
| Events delivered | Number of successfully delivered events, sortable by count or rate of change.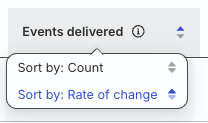 |
| Failures | Number of event failures (due to processing, transformation, or delivery errors) sortable by count or rate of change. |
| Failure rate | RudderStack calculates the failure rate as follows: |
| P95 latency Enterprise plan only | Maximum latency for 95% of the events to reach the destination. See P95 latency alerts for more details. |
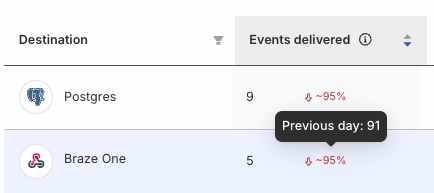
You can also compare the metrics for the current selected period (day, week, or month) against the previous period:
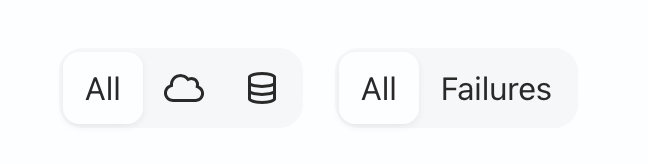
RudderStack provides a toggle to filter your destinations by Cloud and Warehouse. Click the Failures tab to view only the destinations that have event failures.
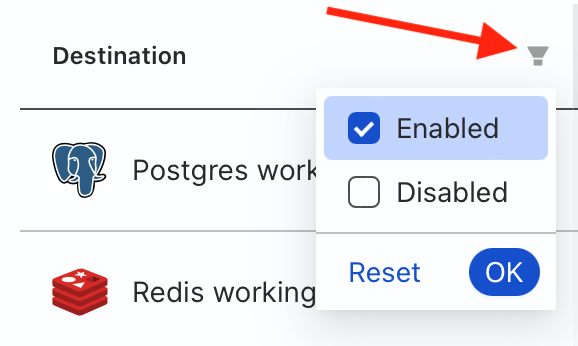
You can also filter metrics for only the enabled/disabled destinations by clicking the filter option in the Destination column:
Get failure metrics
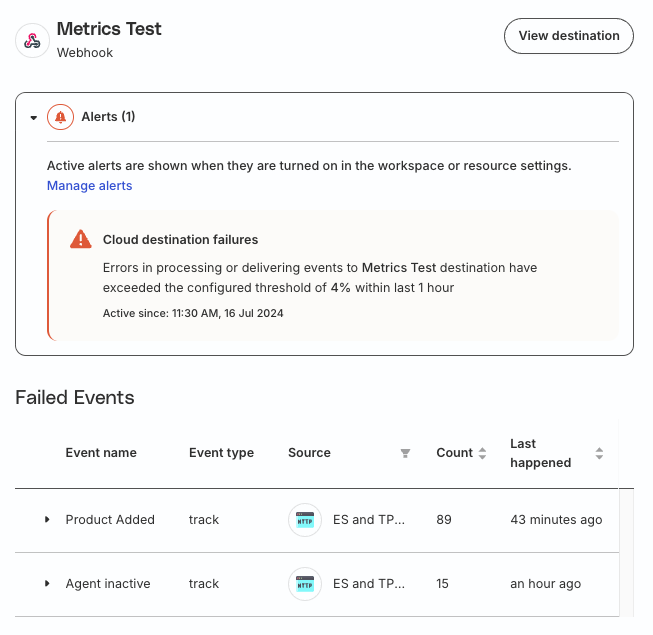
Click any row to get the destination-level data for event failures. A panel pops up on the right with the following information:
- An alerts section containing the following details:
- Alert description.
- Time and date from when the alert is active.
- Failure details.
Cloud destinations
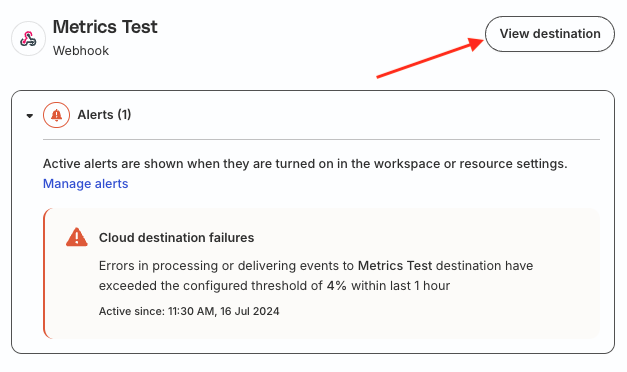
RudderStack provides the following details for the failed events associated with the cloud destination:
- Event name
- Event type (
identify,track,page, etc.) - Source
- Count: Number of failed events.
- Last happened: When the error last occurred.
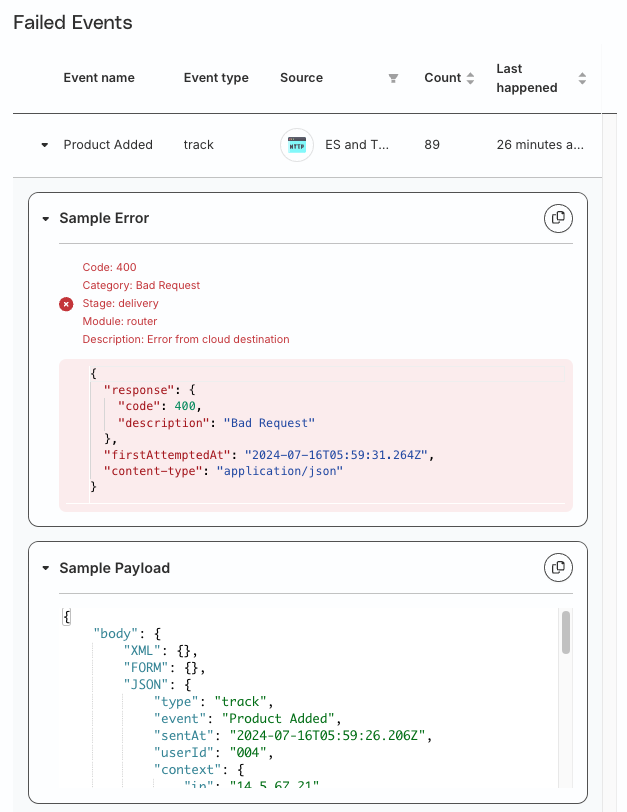
Click the event to see a sample error and failed event payload.
You must have the required PII permissions to see the failed event payload.
Click the View Destination button on the top right to go to the destination page.
Warehouse destinations
RudderStack provides the following details for the failed events associated with the warehouse destination:
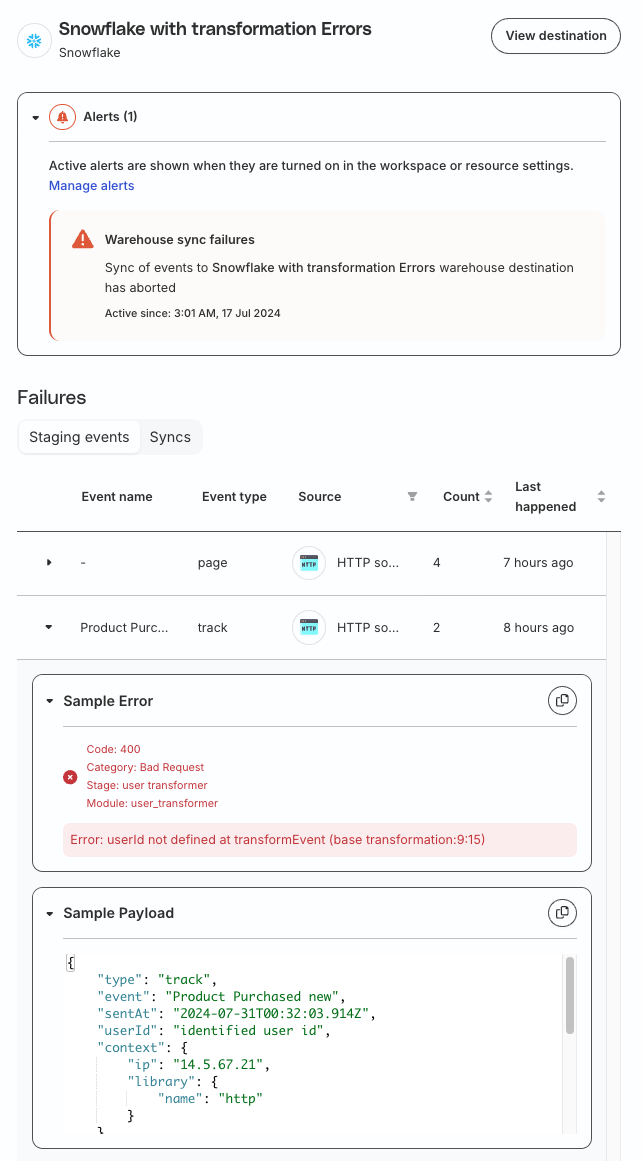
Staging events: These correspond to the errors that occur in the staging process (during transformation or object storage, for example) before the syncs start. You will see the following details in this tab:
- Event name
- Event type (
identify,track,page, etc.) - Source
- Count: Number of failed events with the Event name.
- Last happened: When the error last occurred.
Click the event to see a sample error and failed event payload. For more details, click the View Destination button on the top right.
You must have the required PII permissions to see the failed event payload.
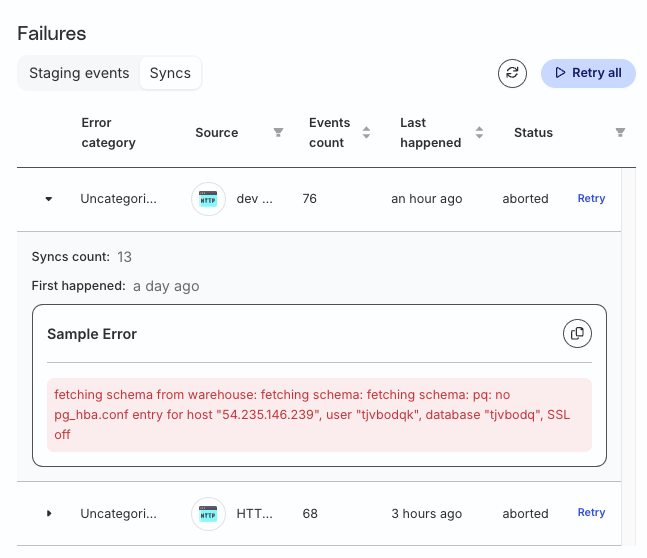
Syncs: These correspond to the errors that occur during the warehouse syncs. You will see the following details:
- Error category
- Source
- Events count
- Last happened
- Status
Click the event to see a sample error. You can also retry syncing the event to the warehouse by clicking the Retry all button.
You must have the required PII permissions to see the failed event payload.
Change percentage calculation
RudderStack calculates the change percentage for the Event Stream destinations as follows:
| Metric | Change percentage equation |
|---|---|
| Events delivered | (Current period count - Prior period count) / Prior period count * 100 |
| Failures | (Current period count - Prior period count) / Prior period count * 100 |
| Failure rate | Current percentage - Prior percentage |
Here, period is the time period by which you want to filter the metrics - one day, one week, or one month.
Reverse ETL
In this view, you get the following information on the latest syncs that are ongoing or completed across each Reverse ETL connection.
- Source-destination connection
- Status of the latest run (In progress, Completed without failures, Completed with failures, or Aborted)
- Duration of the sync
- Sync start time
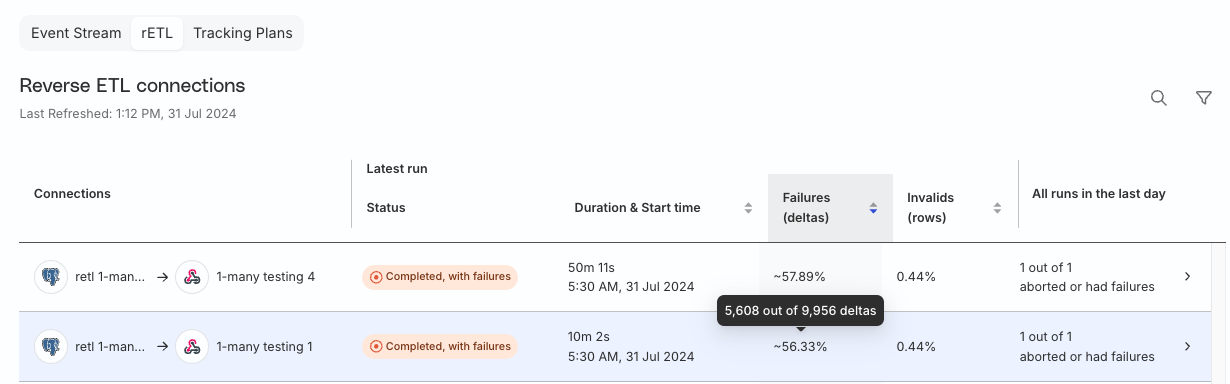
- Failures (Percentage of deltas (new rows) that failed to sync)
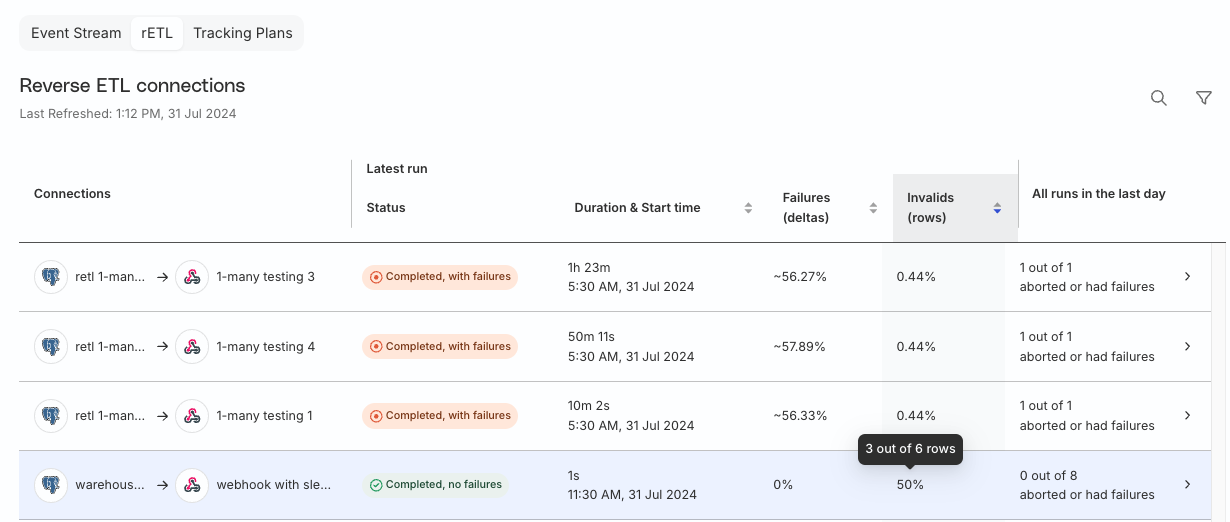
- Invalids (Invalid records sent from the source)
- Summary of failed or aborted syncs in the selected duration (1 day, 1 week, or 1 month)
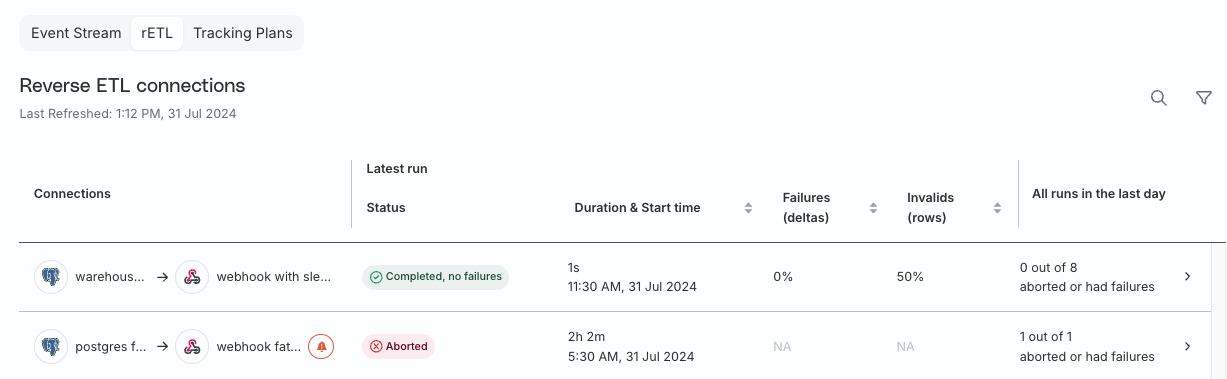
Each row corresponds to an individual connection with details on the latest sync and a summary of the failed or aborted syncs during the selected time period.
The Aborted status code implies an unsuccessful sync due to a number of reasons:
- Sync was aborted or stopped manually.
- RudderStack encountered issues while connecting to the warehouse due to incorrect configuration, changed credentials, or downtime.
Hover over the Failures column to see percentage of failed deltas (new records since last sync). In the below image, the latest run status is Completed, with failures as some deltas failed to sync.
Hover over the Invalids column to see percentage of invalid records sent from the source. In the below image, the latest run status is Completed, no failures as RudderStack did not face any errors or failures while syncing the deltas. However, three out of six rows synced from the source were invalid.
Get sync details
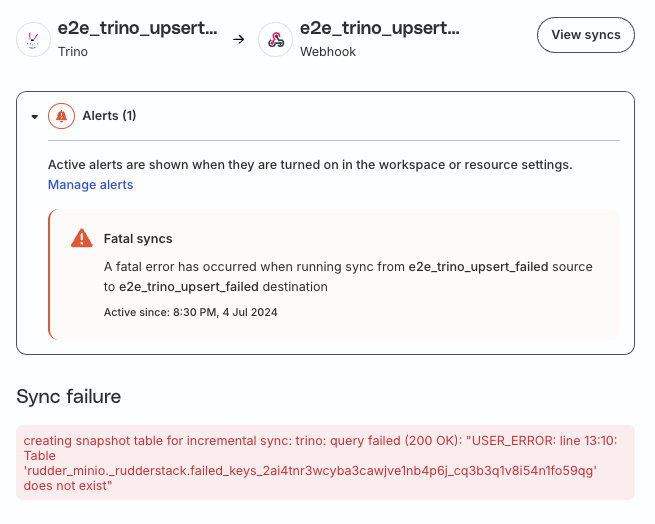
Click any row to get the connection-level alerts and error details. A panel pops up on the right with the following information:
- An alerts section containing the following details:
- Alert description.
- Time and date from when the alert is active.
- Sync failure details
Aborted
The following image highlights a connection with an Aborted status and a Fatal syncs alert:
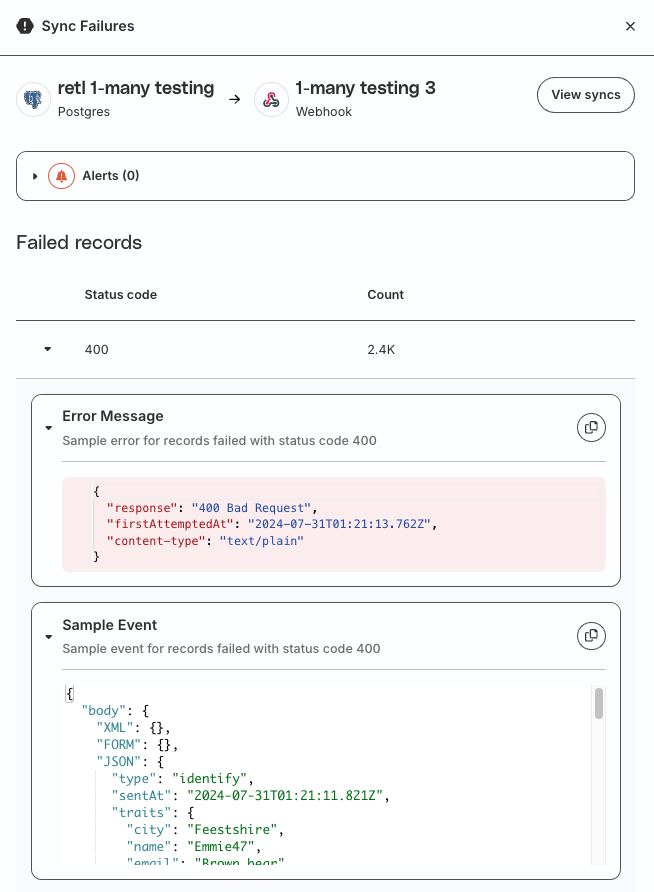
Completed with failures
The following image highlights a connection with a Completed, with failures status. You can click a failed record to see a sample error and event payload.
You must have the required PII permissions to see the failed records.
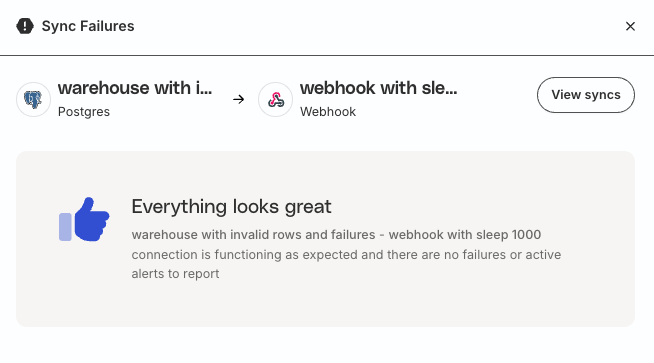
Completed with no failures
The following image highlights a connection with a Completed, no failures status.
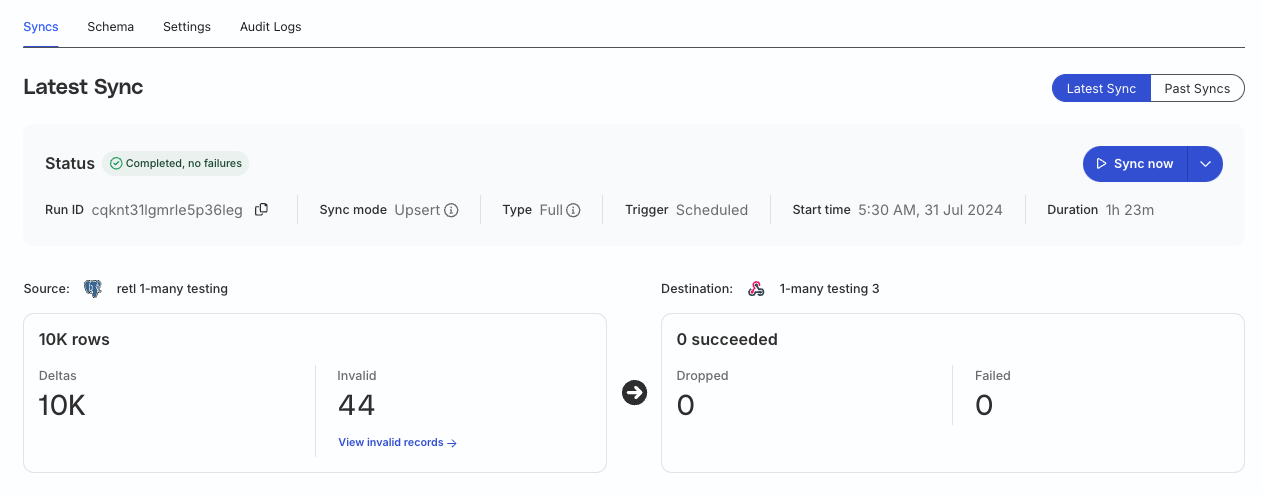
View syncs
Click the View Syncs button on the top right to get the additional sync-specific details like:
- Sync type (full/incremental)
- Number of rows in source
- Number of deltas (new data since last sync)
- Invalid records
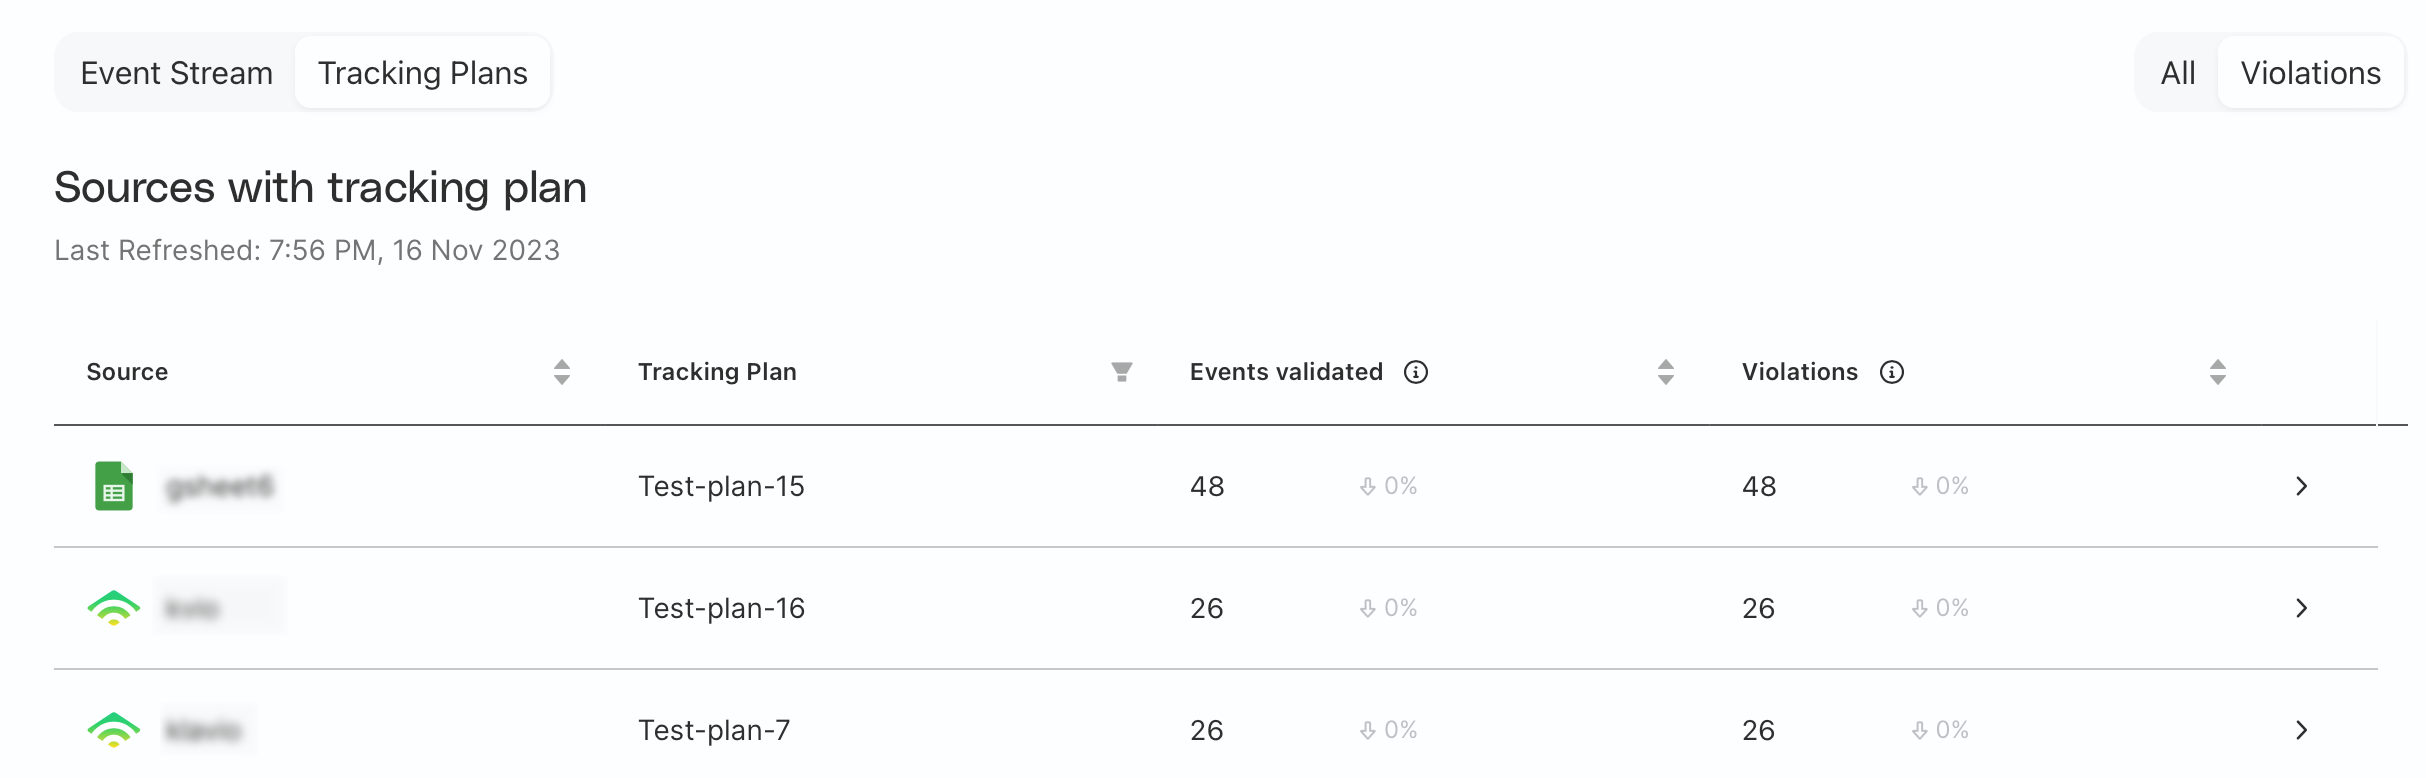
Tracking plans
In this view, you get a list of all the sources connected to a tracking plan in your workspace with the following details (along with the change percentage):
- Tracking Plan
- Events validated (sortable by count or rate of change)
- Violations (sortable by count or rate of change)
RudderStack also provides a Violations tab to view only the sources that have tracking plan violations.
Validation error details
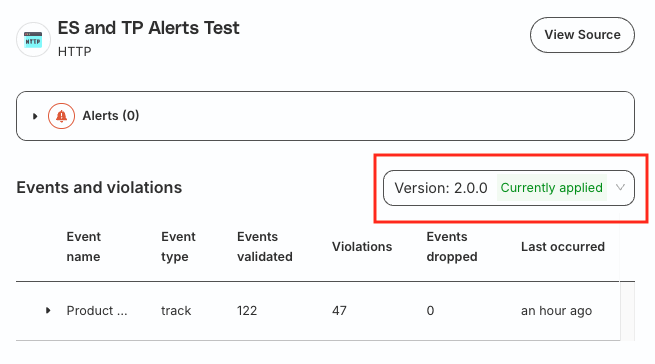
Click a row to get the validation error details. A panel pops up on the right with the following details:
An alerts section containing the following details:
- Alert description.
- Time and date from when the alert is active.
Events and violation details like:
- Event name
- Event type (
identify,track,page, etc.) - Events validated
- Events dropped
- Last occurred: When the error last occurred.
Use the Version dropdown to view the metrics for a tracking plan version. This is helpful if your tracking plan has undergone revisions recently.
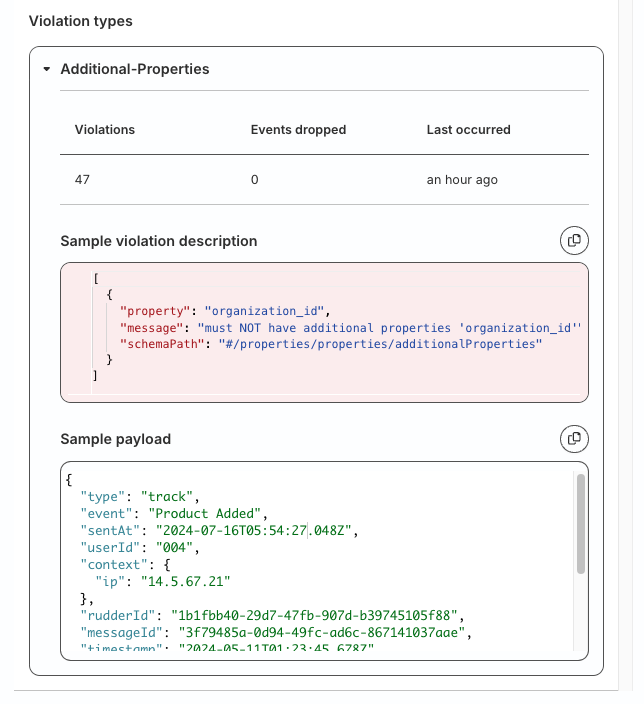
Click the event to see the violation type along with a sample violation description and event payload.
You must have the required PII permissions to see the Tracking Plan violation samples.
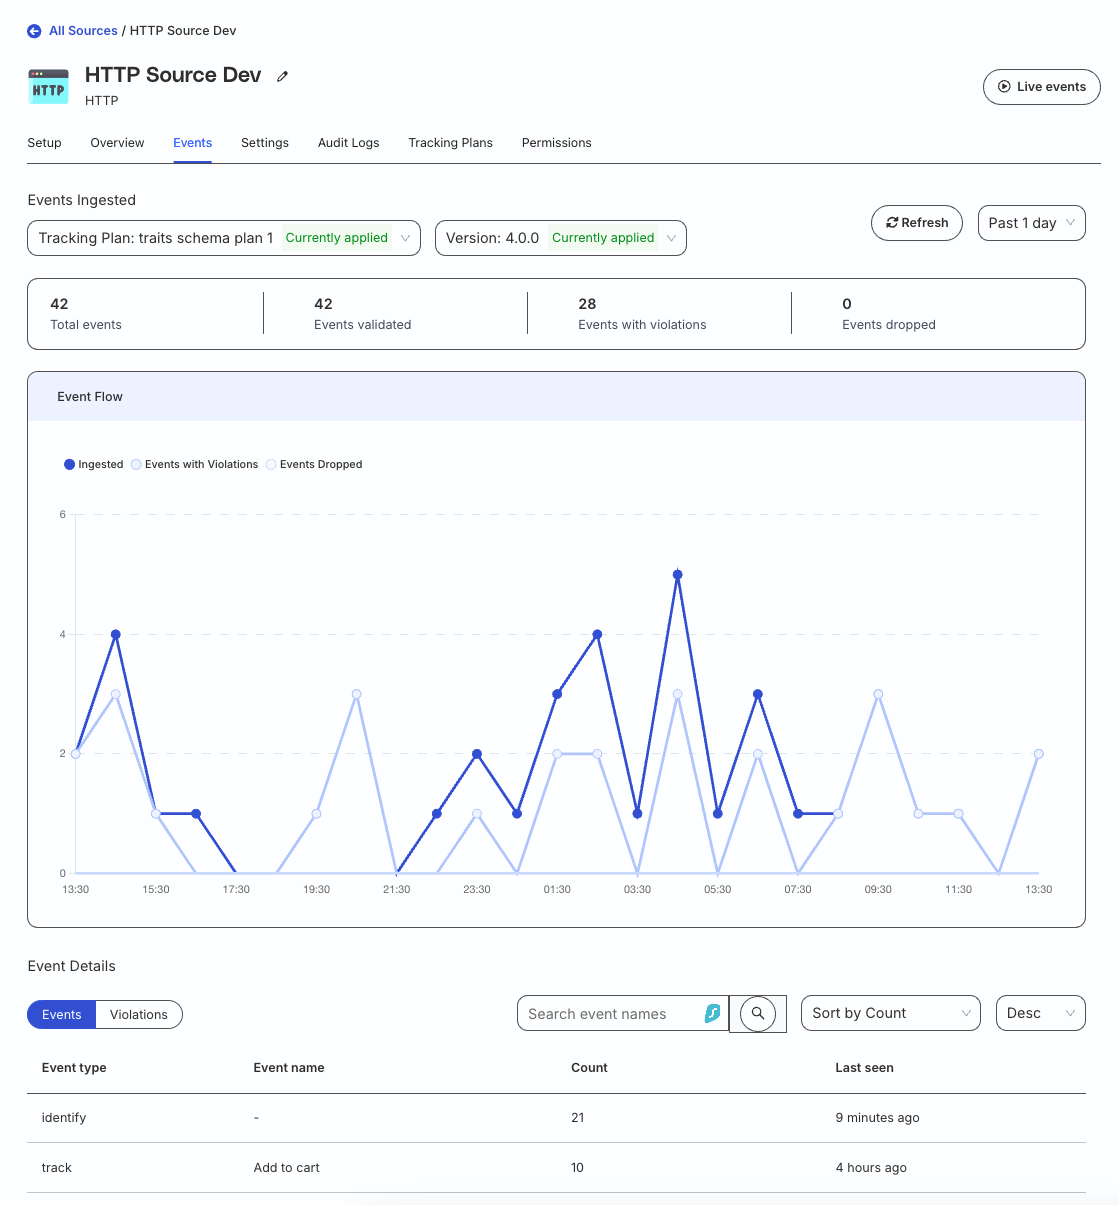
Click View Source to go to the source page. You will be redirected to the Events tab where you can view the detailed event ingestion and violation metrics.