Event Usage Details
2 minute read
RudderStack provides a comprehensive reporting feature that lets you view the monthly event volume across your Event Stream, ETL, and Reverse ETL pipelines. You can also view your event usage across time and break it down by source.
This guide walks you through the reporting feature in detail.
View events usage
To use the reporting feature, log in to your RudderStack dashboard and navigate to Settings > Organization > Usage.
Here, you get an overview of your organization’s event usage by product.
Usage and monthly event limit
In this section, you will see your current RudderStack plan and the monthly event limit.

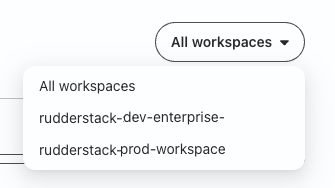
If your plan has support for multiple workspaces, you will also see a All workspaces tab. Here, you can filter your monthly event usage data by workspace.
Monthly event usage
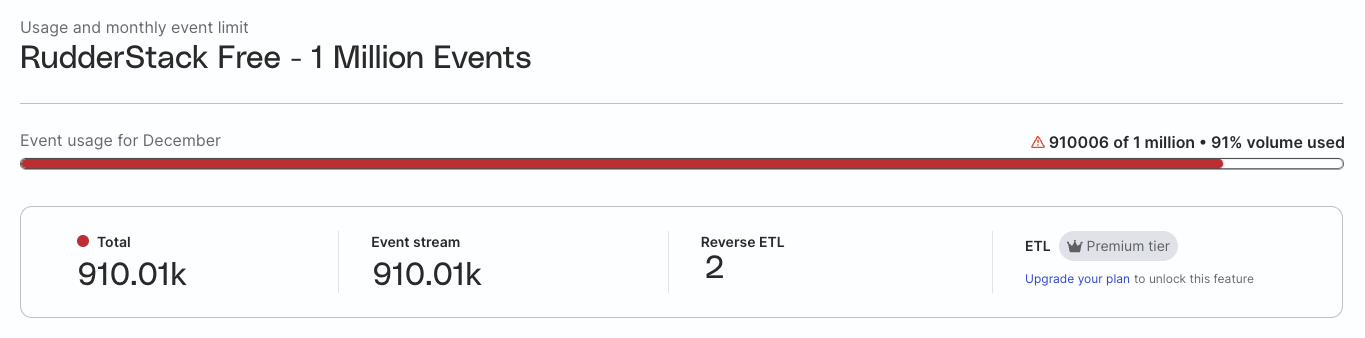
This section gives you a quick overview of the event volume for the current month by product type (Event Stream, ETL, and Reverse ETL).
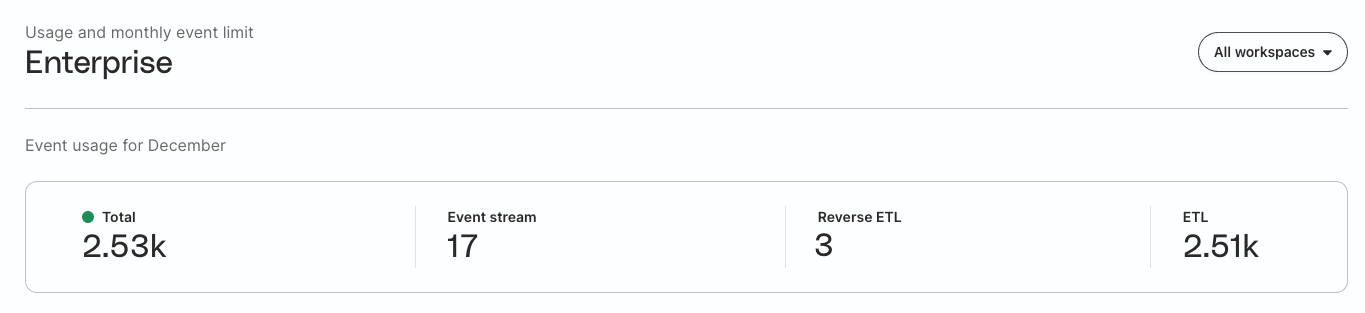
You can also see the details on event volume used till date and the option to upgrade your plan.
Usage by source type
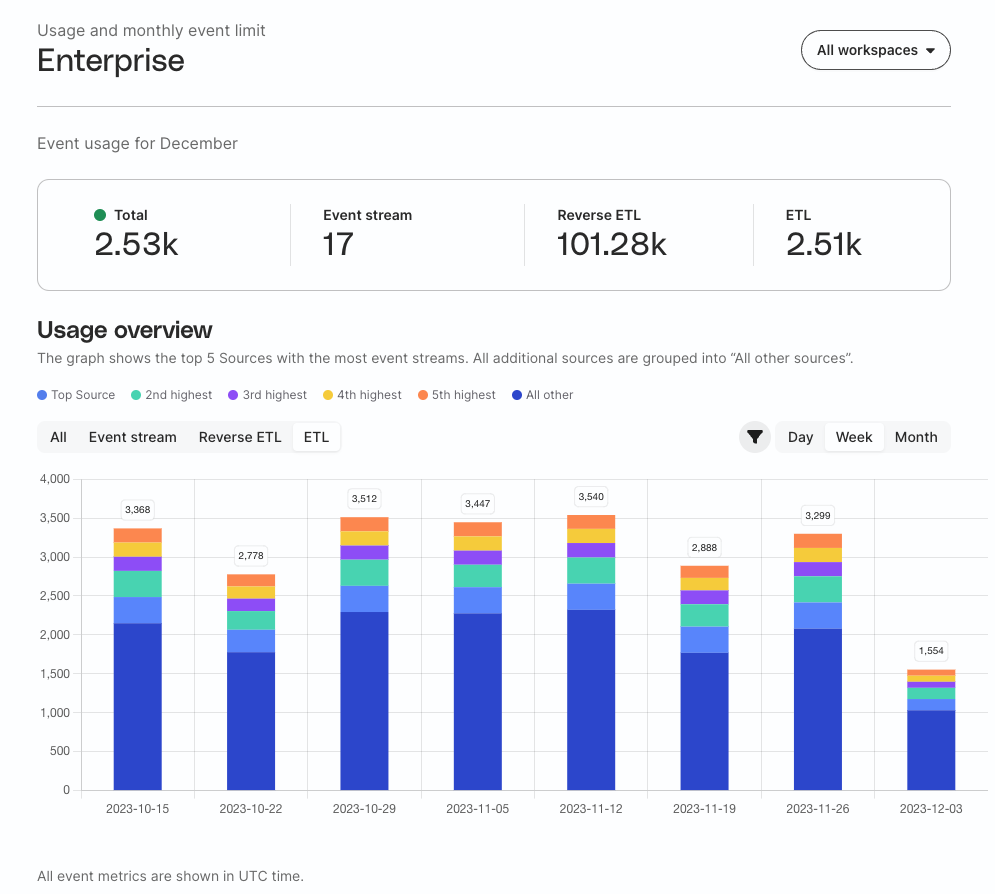
In the Usage overview section, you get tabbed charts that reflect your events usage by product type (Event Stream, Reverse ETL, and ETL). You also get details on the top five sources by event volume. Note that all the remaining sources are grouped into All other sources.
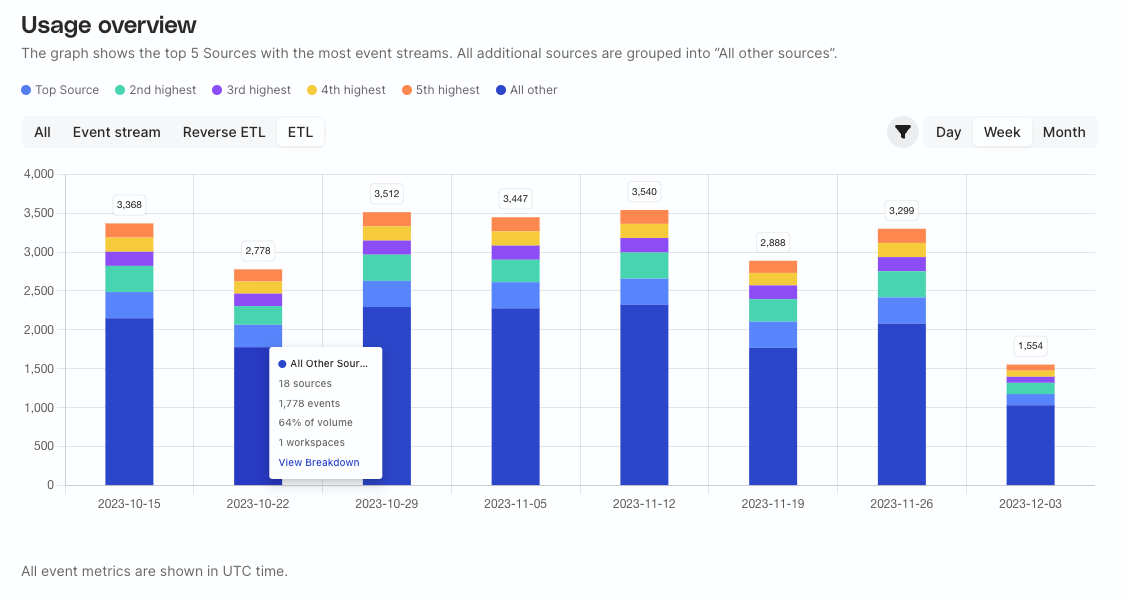
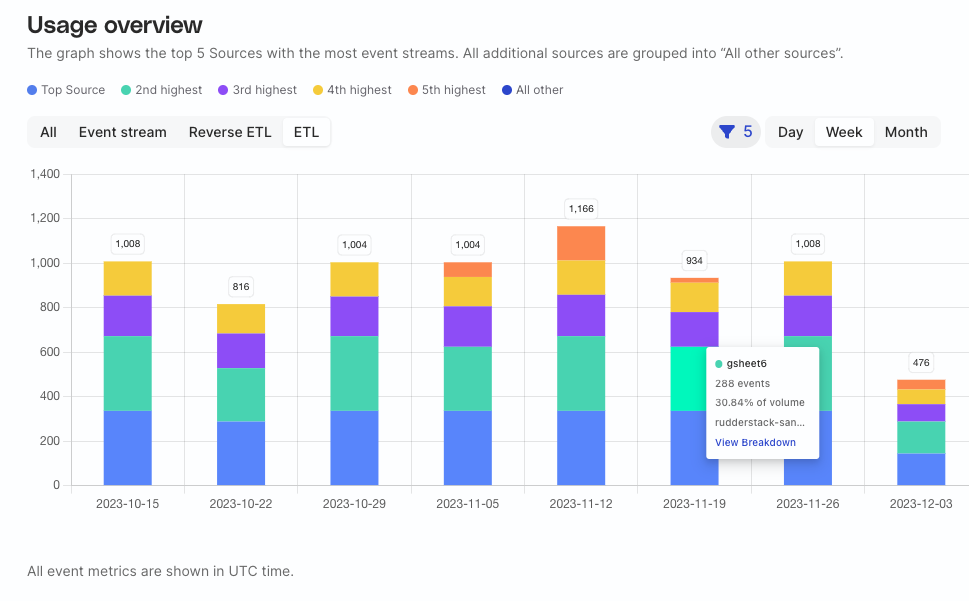
You can also filter the event usage data by source and time period (day, week, or month). Hover on the chart to see the following metrics:
- Source name
- Number of ingested events
- Percentage of event volume
- Workspace associated with the source
You can filter data for up to 10 sources.
Usage breakdown by source
To view the events usage breakdown by source for the selected time period, click the View Breakdown option:
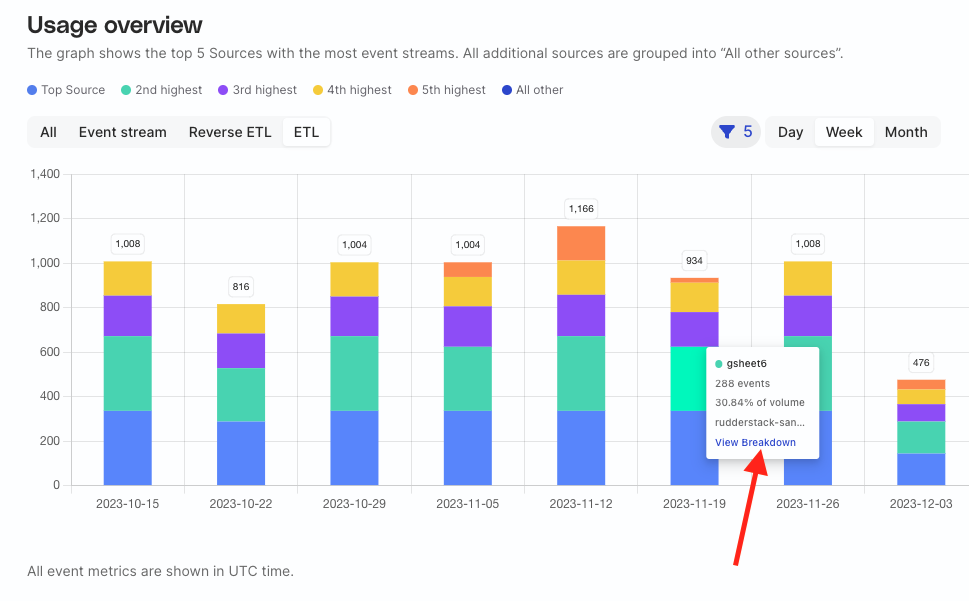
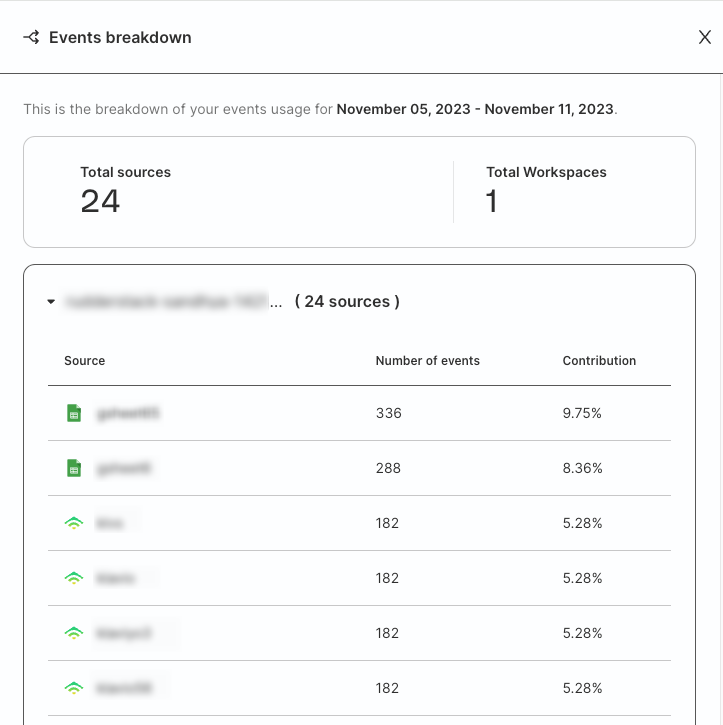
Here, you will see a detailed event usage breakdown for all the sources in your workspace for the selected time period, including number of ingested events (not events sent to the destination).