Source Event Metrics
2 minute read
Important consideration
The event metrics covered in this guide may not reflect real-time events due to reporting latency.
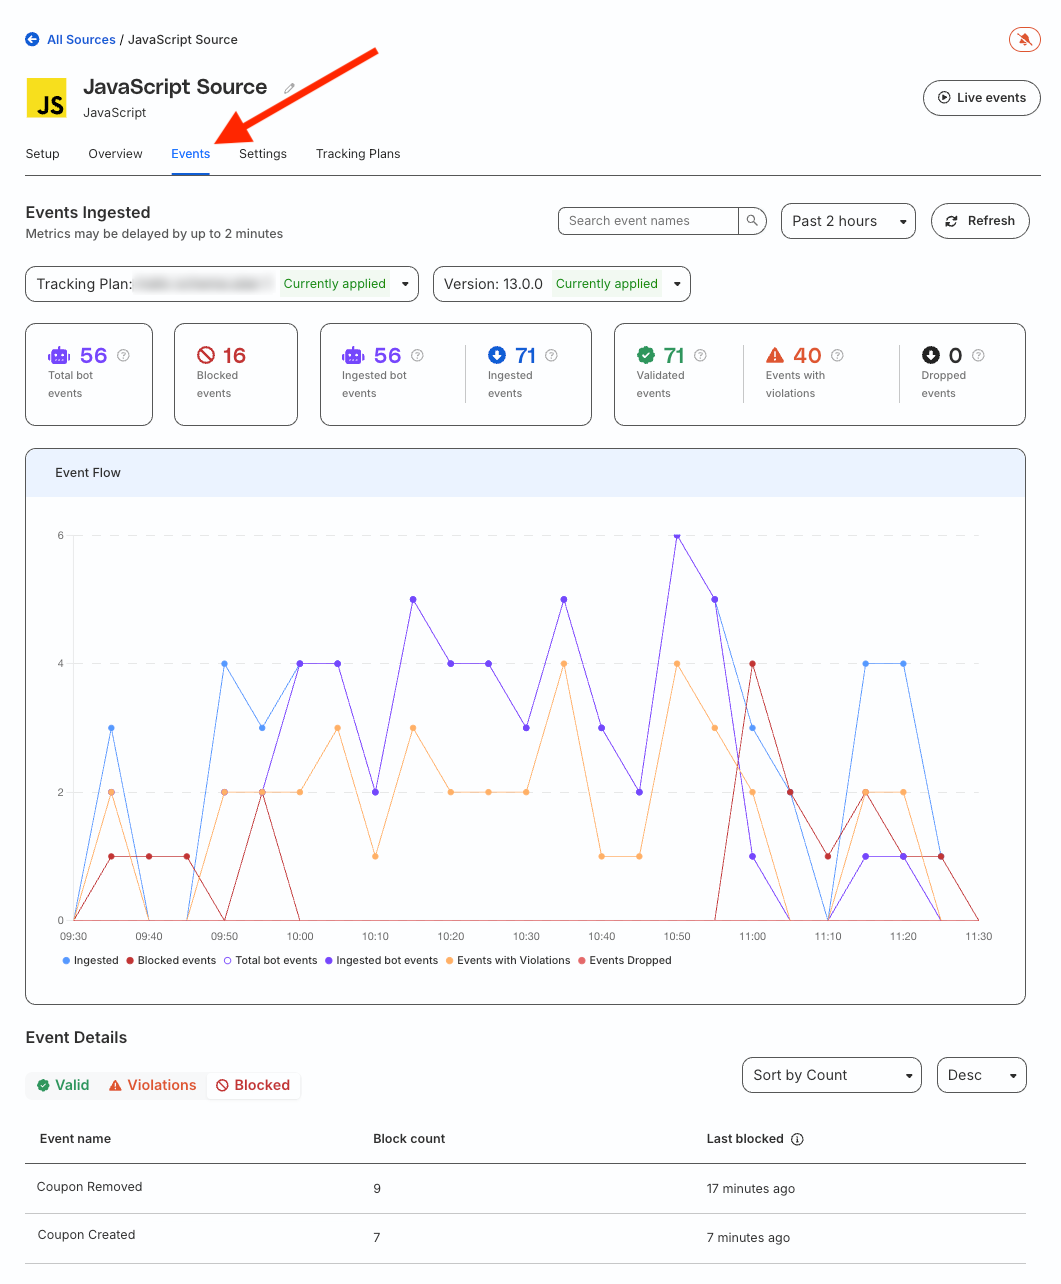
Click the Events tab on your source page to view detailed metrics for the ingested events along with their details.
Events ingested
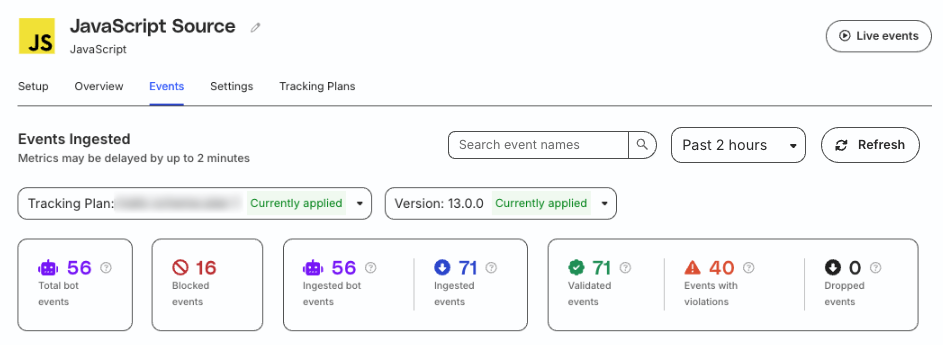
The Events ingested section shows the following metrics:
Number of events ingested and blocked by the source.
Number of bot events ingested and blocked by the source.
If you have a Tracking Plan connected to the source, you also see the following details:
- Number of events validated by the Tracking Plan.
- Number of events containing Tracking Plan violations.
- Number of events dropped as a result of these violations.
Filtering window
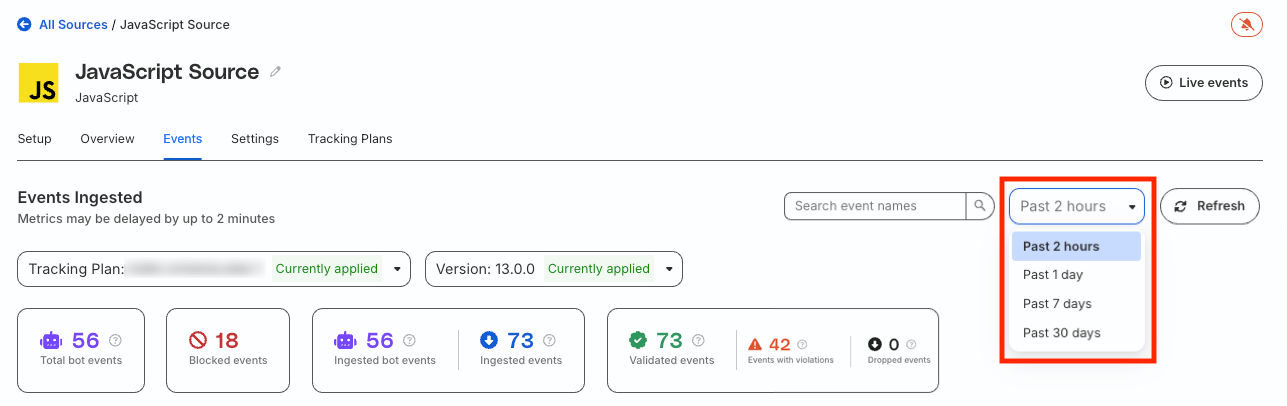
You can filter the above metrics for the past 2 hours, 1 day, 7 days, and 30 days.
The 2-hour filtering window is available only in RudderStack’s Growth and Enterprise plans.
For Free plan users, the default filtering window is 1 day.
Event flow graph
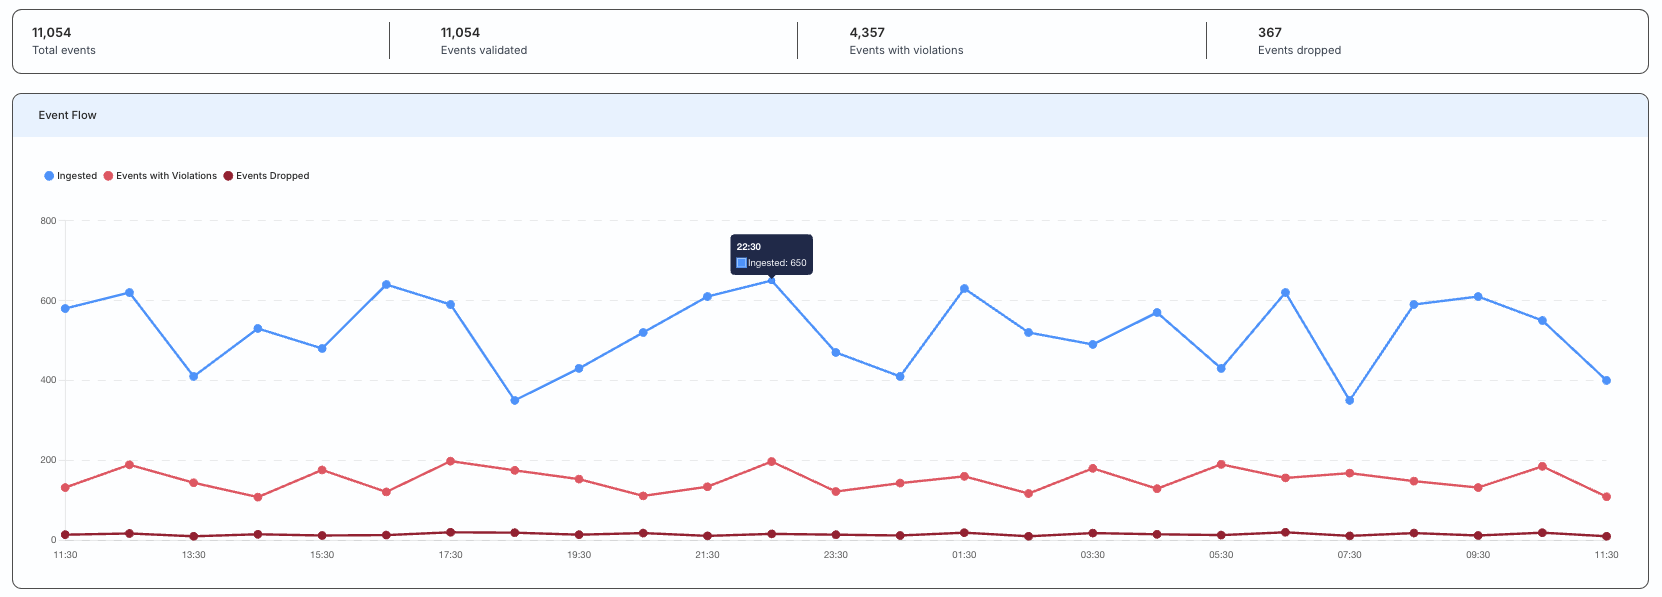
An event flow graph highlights the event ingestion and processing trends over the selected time period.
Event details
The Event details section shows the ingested events and violations arising due to non-compliance with the connected Tracking Plan.
You can search for specific event names or sort all events by type, name, count, and last occurred.
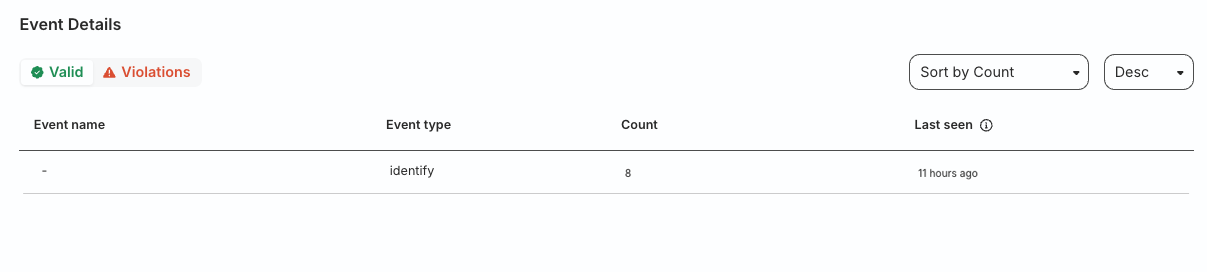
Event metrics
The Events tab includes the following details:
| Column name | Description |
|---|---|
| Event type | Type of event, for example, identify, track, etc. |
| Event name | Name of the event in case the type is track. |
| Count | Number of events received in the selected time period. |
| Last seen | Time since the event last occurred. |
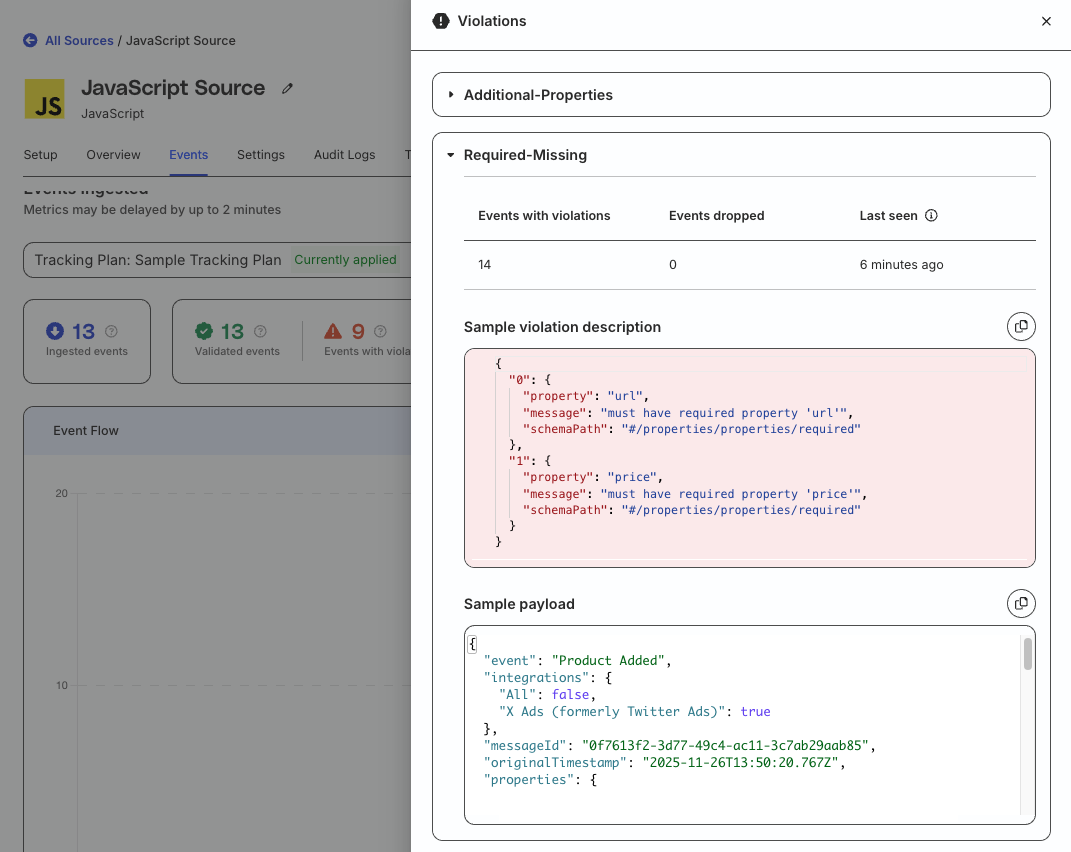
Violation details
The Violations tab includes the following details:
| Column name | Description |
|---|---|
| Event name | Name of the event in case the type is track. |
| Event type | Type of event, for example, identify, track, etc. |
| Events validated | Number of events validated against the connected Tracking Plan. |
| Events with violations | Number of events containing any Tracking Plan violations. |
| Events dropped | Number of events dropped as a result of violations. |
| Last seen | Time since the event that caused the violation last occurred. |
Click a row to see the violation details, including the violation type and a sample payload.
Required permissions
Admins have full access to view the Tracking Plan violation details.
Members must have the Tracking Plan Violation Samples PII permission to see the violation details.
Blocked events
The Blocked tab includes the following details:
| Column name | Description |
|---|---|
| Event name | Name of the blocked event. |
| Block count | Number of times the event was blocked. |
| Last blocked | Time since the event was last blocked by RudderStack. |
