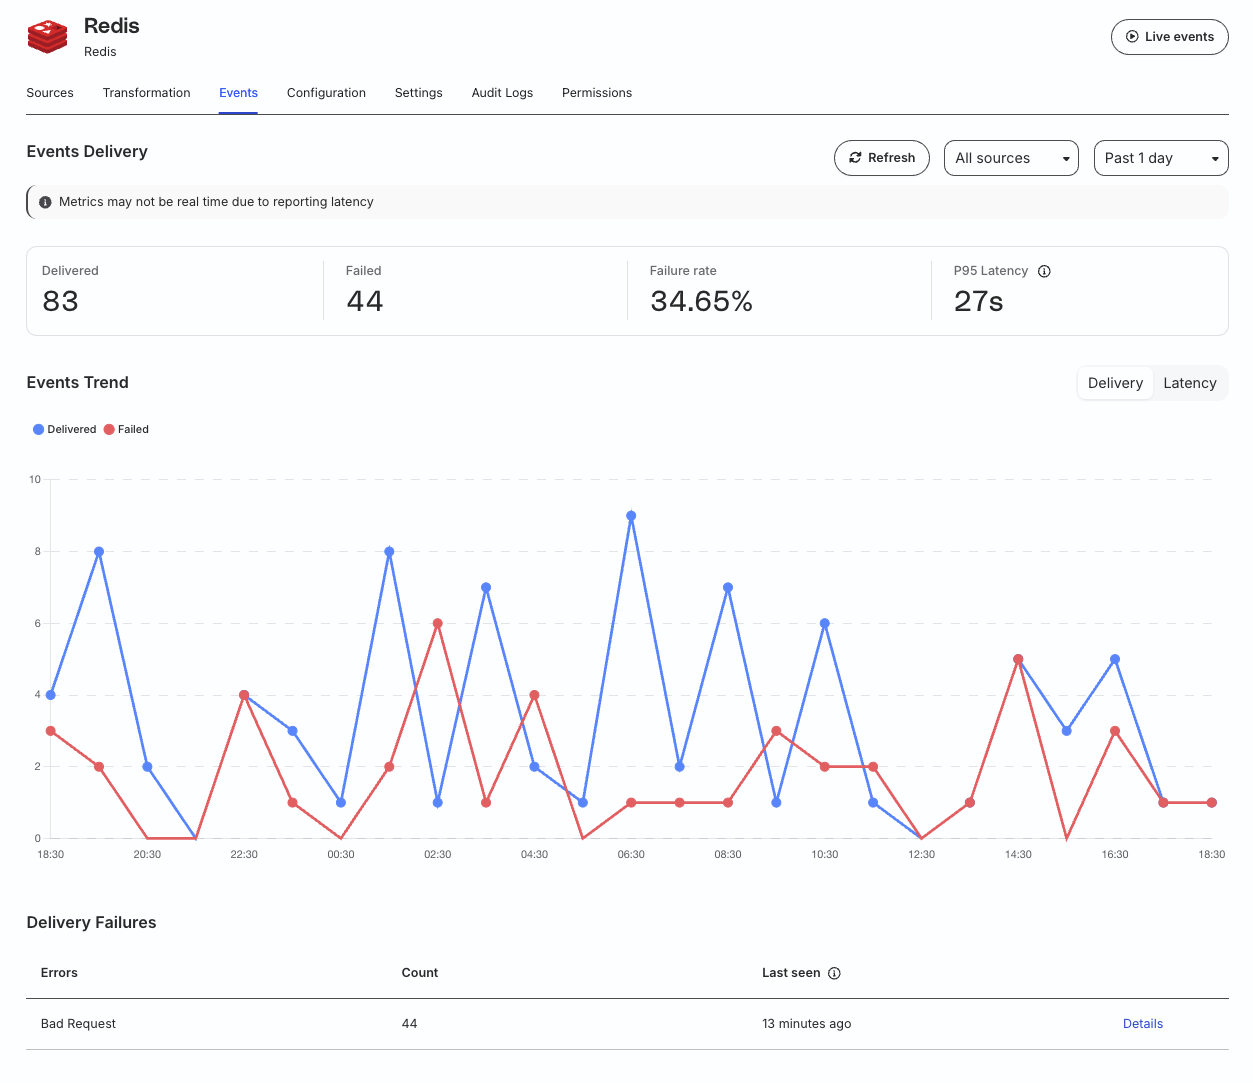
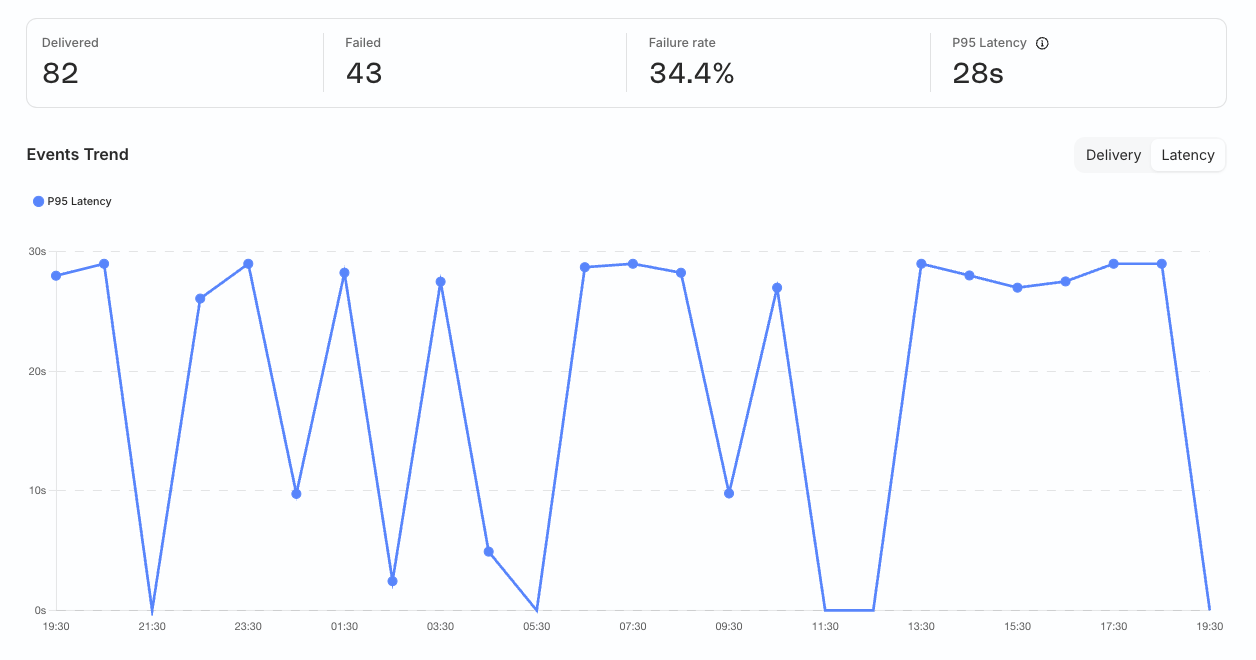
Switch to the Latency tab to view the P95 latency trends for the cloud destination over the specified time period.
Factors affecting event delivery latency
One or more of the following factors can increase event delivery latency:
Factor
Notes
Connection to multiple sources
If a destination is connected to two sources wherein one source has a significantly higher event volume than the other, then the high volume of one source can impact the delivery latency of the events coming from the other source.
Destination response time
Delivery speed depends on the destination API’s performance. Destination rate limits and downtime can impact delivery latency.
Transformation connection, time, and complexity
A destination connected to multiple sources and a transformation can have a higher delivery latency compared to a destination connected to the same sources without a transformation.
A complex and/or long-running transformation can cause delays in event processing, which can increase latency.
Handling volume spikes and cluster scaling
RudderStack dynamically scales its clusters up or down to handle sudden spikes or any variations in event volume. During this process, it may temporarily pause event processing to balance the load across nodes, ensuring the events are processed in the correct order. While this safeguards data integrity, it may create a temporary event backlog and impact the delivery latency.
Contact the RudderStack team to learn more about provisioning for spikes.
Warehouse destinations
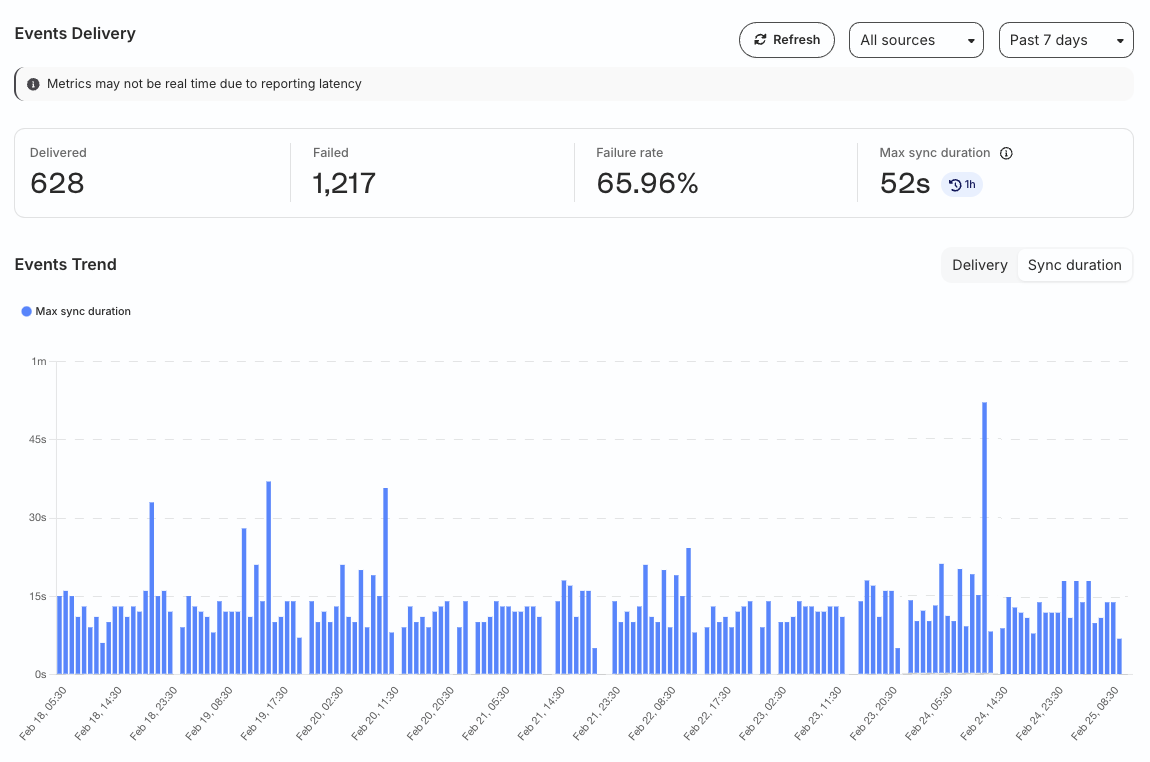
The Event delivery section includes the following metrics for warehouse destinations:
Total events delivered to the destination.
Number of events that failed to deliver and the failure rate.
Maximum sync duration for the specified time period. See Sync duration for more information on this metric.
Event delivery trend
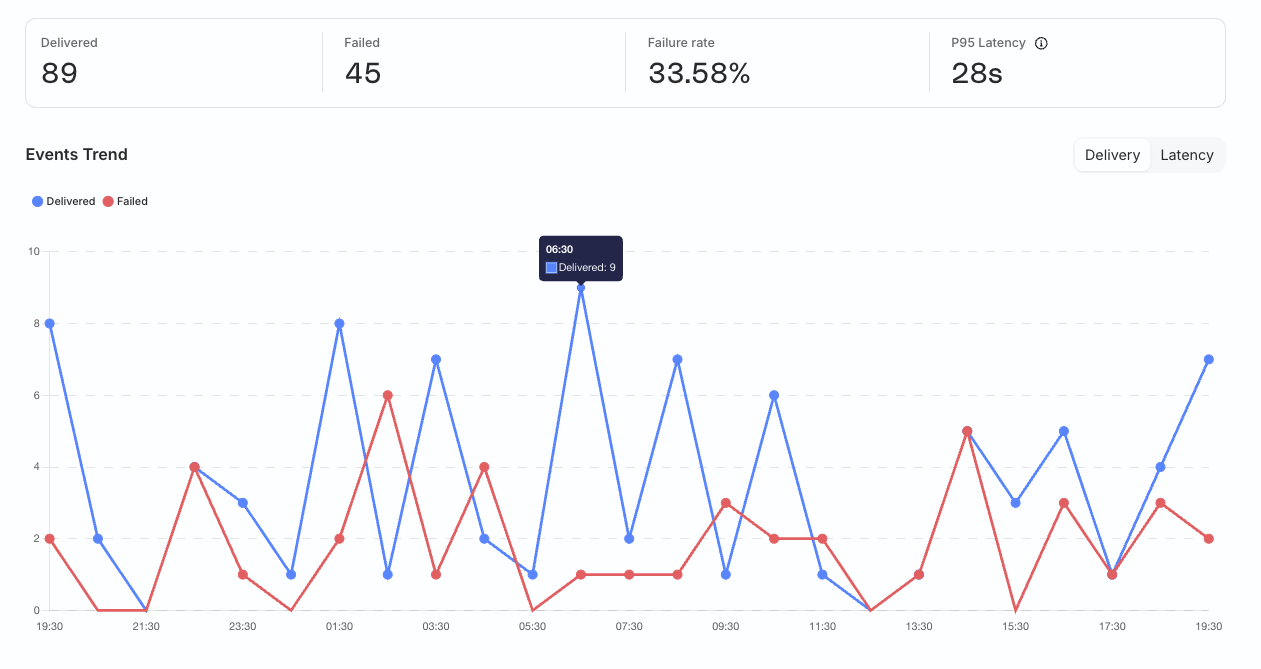
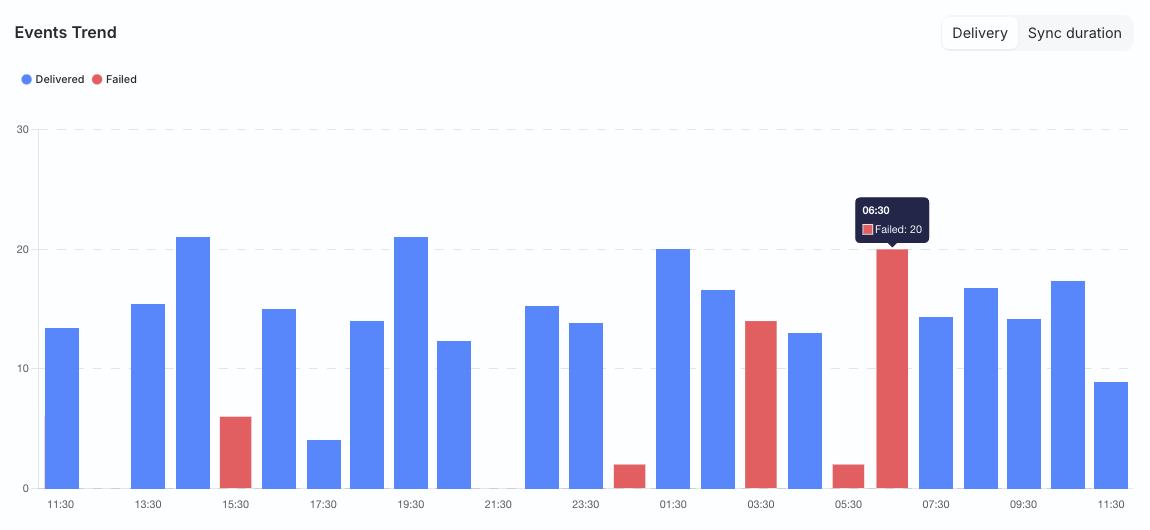
The Delivery tab shows how events were delivered to the warehouse destination over the selected time period.
Switch to the Sync duration tab to see the trends for maximum sync duration, that is, the longest sync duration for all the data syncs within each specified time bucket. The frequency of these syncs is configurable via the Sync Frequency connection setting for the warehouse destination.
Event details (Event Stream)
These metrics are shown only for cloud destinations connected to Event Stream sources.
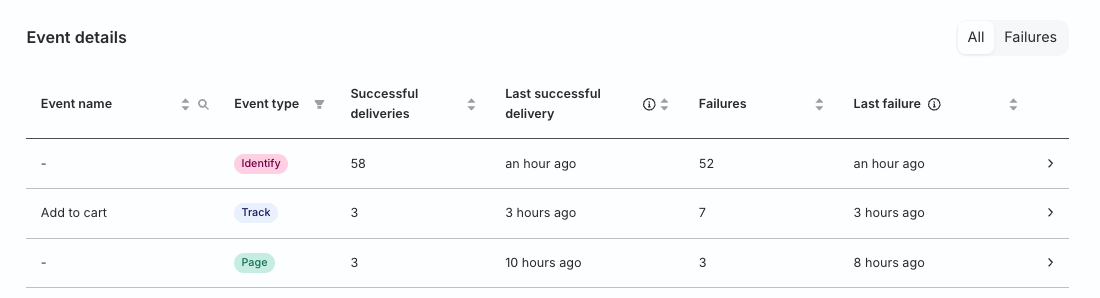
The following table lists all events sent to the cloud destination within the specified time period.
Column name
Description
Event name
Name of the event in case the type is track.
Event type
Type of event, for example, identify, track, etc.
Successful deliveries
Number of events delivered to the destination successfully.
Last successful delivery
Time since the last event was delivered to the destination successfully.
Failures
Number of events that failed to reach the destination.
Last failure
Time since the last event failed to reach the destination.
View failed event details
Required permissions
Admins have full access to view the delivery failure details.
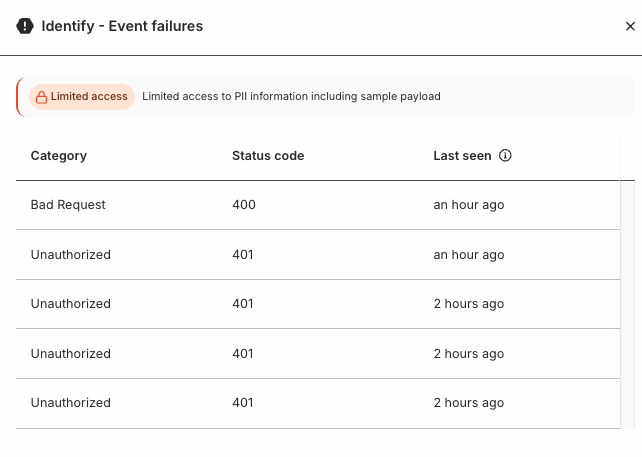
Members must have the Destination Failure Samples PII permission to see the delivery failure details. Otherwise, they see the following message:
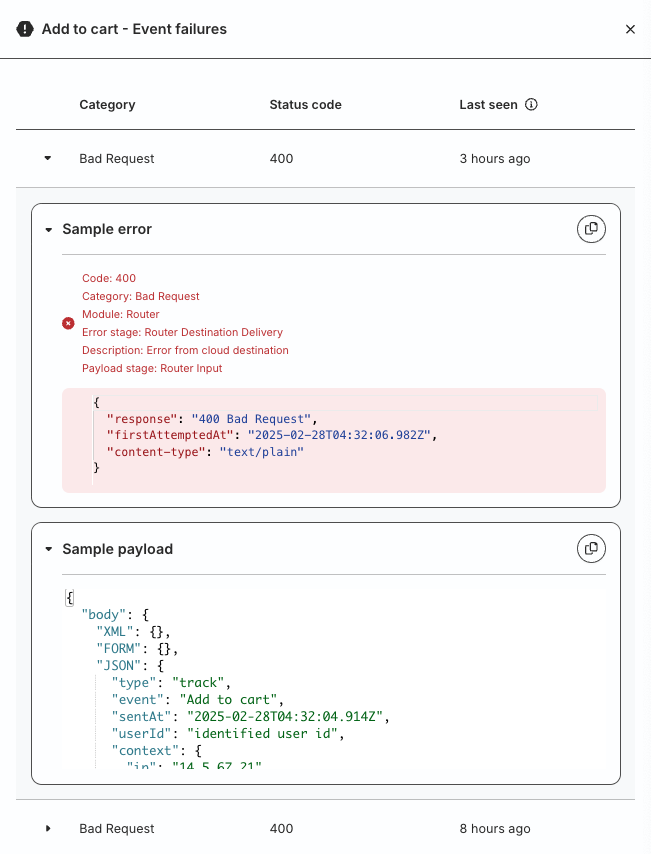
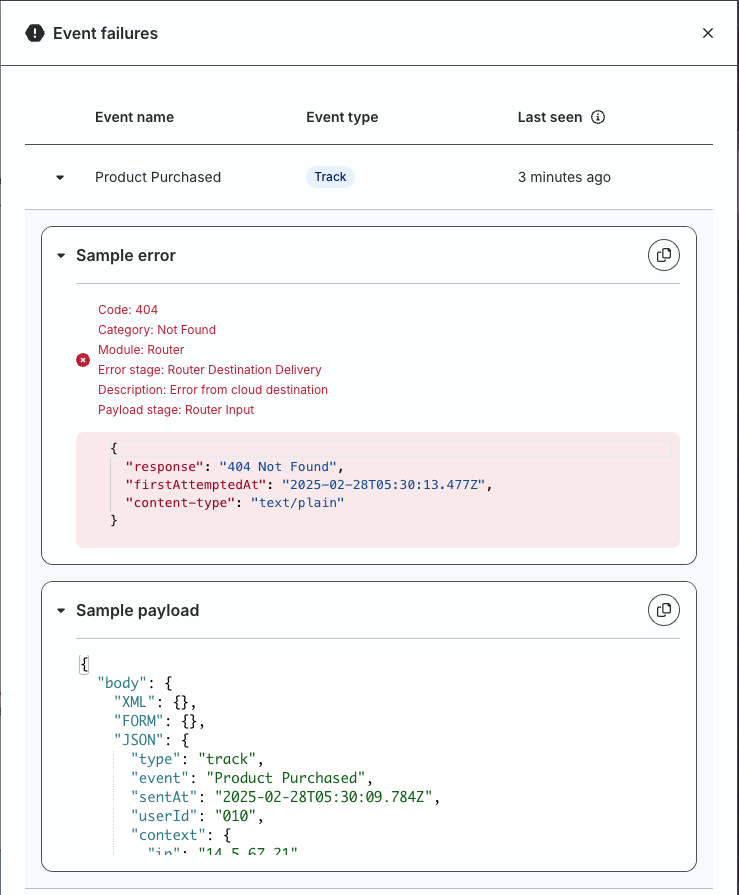
Click a row to see the event failure details along with the sample error and payload.
Delivery failures (Warehouse and RETL)
These metrics show the errors that caused delivery failure for:
This site uses cookies to improve your experience. If you want to learn more about cookies and why we use them, visit our cookie policy. We'll assume you're ok with this, but you can opt-out if you wish
Privacy Overview
This site uses cookies to improve your experience while you navigate through the website. Out of these cookies, the cookies that are categorized as necessary are stored on your browser as they are as essential for the working of basic functionalities of the website. We also use third-party cookies that help us analyze and understand how you use this website. These cookies will be stored in your browser only with your consent. You also have the option to opt-out of these cookies. But opting out of some of these cookies may have an effect on your browsing experience.
Necessary cookies are absolutely essential for the website to function properly. This category only includes cookies that ensures basic functionalities and security features of the website. These cookies do not store any personal information.