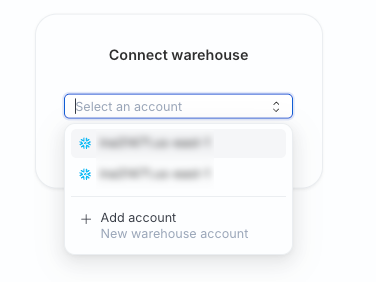
Create a data graph by connecting a warehouse, defining entity and event models, and configuring relationships between them.
Before configuring the warehouse credentials, you need to grant certain permissions on your BigQuery warehouse for RudderStack to access data from it.
- Create a role and grant permissions in your GCP project.
- Create a service account and attach the role to it.
- Create and download the JSON key for the service account.
- Create the RudderStack schema and grant permissions to the service account.
Then, configure the warehouse credentials:
| Setting | Description |
|---|
| Name | Assign a name for the warehouse account. |
| Credentials | Add the contents of the GCP service account credentials JSON downloaded above. |
| Project ID | Specify your GCP project ID where your BigQuery database is located. |
| Service Account | Specify your GCP service account. |
For more details on the above settings, see the BigQuery documentation.
Before configuring the warehouse credentials, you must grant certain permissions in your Databricks instance for RudderStack to access data from it.
- Add a new user by following the steps in the Databricks documentation.
- Create RudderStack schema and grant permissions to the user.
Then, configure the warehouse credentials:
| Setting | Description |
|---|
| Name | Assign a name for the warehouse account. |
| Host | Enter the server hostname of your Databricks cluster or SQL warehouse. |
| Port | Enter the associated port number for the Databricks cluster or SQL warehouse. |
| Path | Enter the associated HTTP path. |
| Authentication Type | Select the authentication mechanism from the dropdown. RudderStack supports M2M OAuth and Personal Access Token. |
| Client ID | If authentication is set to M2M OAuth, enter the client ID for the service principal. |
| Client Secret | If authentication is set to M2M OAuth, enter the corresponding client secret. |
| Token | If authentication is set to Personal Access Token, enter your Databricks access token. |
| Catalog | Enter the name of your Unity catalog. |
For more details on the above settings, see the Databricks documentation.
Before configuring the warehouse credentials, you must grant certain permissions on your Redshift warehouse for RudderStack to access data from it.
- Create a new user in Redshift.
- Create RudderStack schema and grant permissions to the user.
- Grant user the required permissions on your schema and table.
Then, configure the warehouse credentials:
| Setting | Description |
|---|
| Name | Assign a name for the warehouse account. |
| Host | Enter the host name of your Redshift service. |
| Port | Enter the port number associated with the Redshift database instance. |
| Database | Enter the database name of your Redshift instance from where RudderStack ingests the data. |
| User | Enter the name of the Redshift user created while granting permissions. |
| Authentication Type | Select the authentication mechanism from the dropdown. RudderStack supports IAM (recommended) and Username Password Authentication. |
| IAM Role ARN | If authentication is set to IAM, enter the ARN of the IAM role you created while granting permissions. |
| Cluster Identifier | If authentication is set to IAM, enter your AWS cluster ID. |
| Cluster Region | If authentication is set to IAM, enter your AWS cluster region. |
| Password | If authentication is set to Username Password Authentication, enter the password for the user specified in the User field. |
| SSL Mode | Select the SSL mode as Disable or Require depending on how RudderStack should connect to your Redshift instance. |
For more details on the above settings, see the Amazon Redshift documentation.
Before configuring the warehouse credentials, you must grant certain permissions on your Snowflake warehouse for RudderStack to access data from it.

You must have the ACCOUNTADMIN role to grant these permissions.
- Create a new role and user in Snowflake.
- Create RudderStack schema and grant permissions to the role.
- Grant permissions on your warehouse, database, schema, and table.
Then, configure the warehouse credentials:
| Setting | Description |
|---|
| Name | Assign a name for the warehouse account. |
| Authentication Type | Select the user authentication mechanism from the dropdown. RudderStack supports Username Password Authentication and Key Pair Authentication. |
| Account | Specify the warehouse account ID that is a part of your Snowflake URL, for example, qya56091.us-east-1 |
| Database | Enter the name of the database in which your data resides. |
| Warehouse | Specify the name of your data warehouse. |
| User | Enter the name of the user that has the required read/write access to the above database. |
| Role | Specify the role you want to assign to the above user. For syncing the data, you can use this role apart from the default role (RUDDER_ROLE) you created above. |
| Password | If authentication is set to Username Password Authentication, enter the password for the user specified in the User field. |
| Private Key | If authentication is set to Key Pair Authentication, enter the generated private key and make sure to include the delimiters. |
| Private Key Passphrase | If your private key is encrypted, specify the password you set while encrypting the private key.
Note: The user authentication will fail if your private key is encrypted and you do not specify the passphrase. |
For more details on the above settings, see the Snowflake documentation.
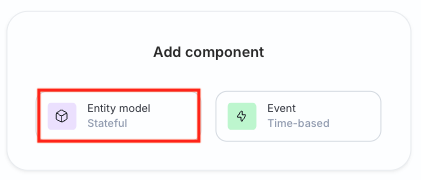
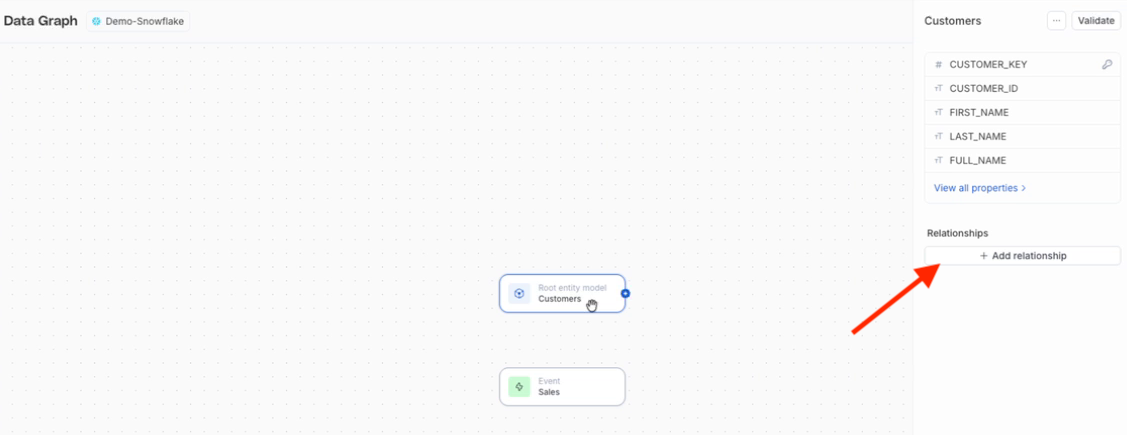
You can now continue by adding more models to the data graph.
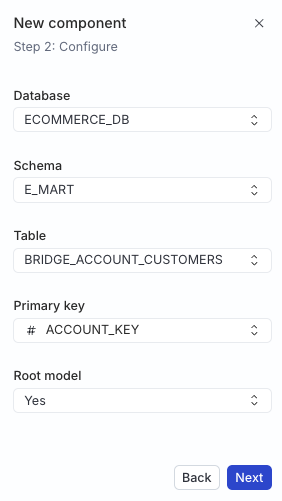
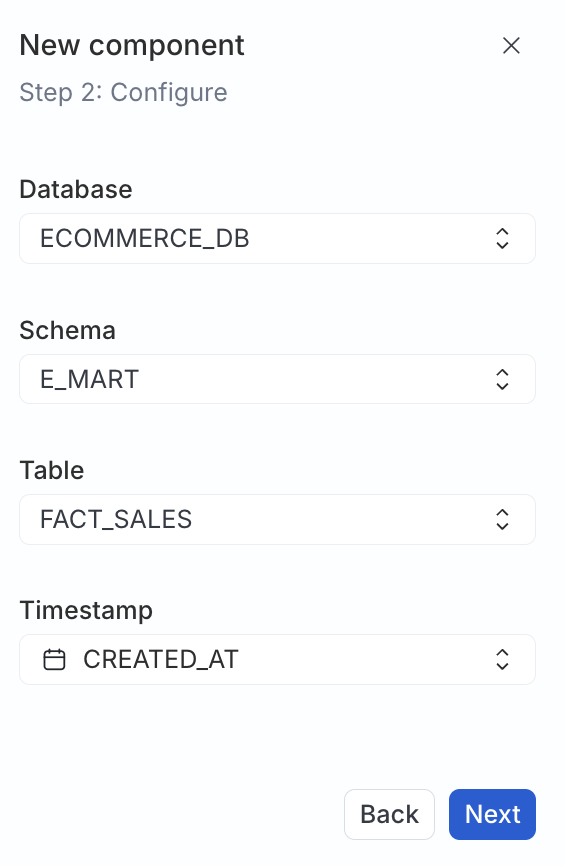
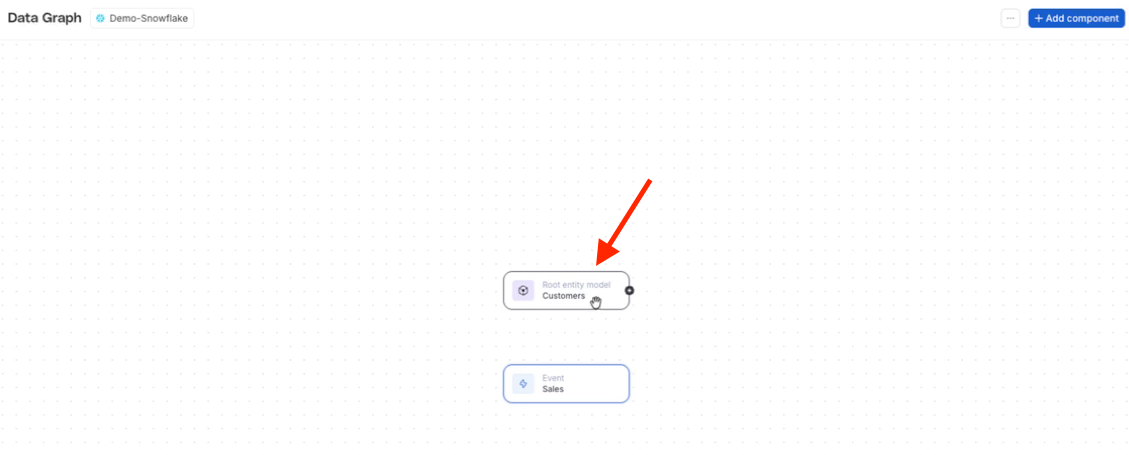
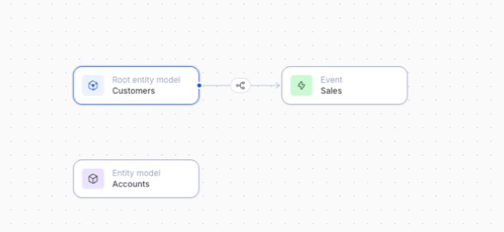
You now have two models on the canvas of your data graph — an entity model and an event model.
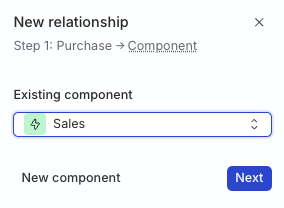
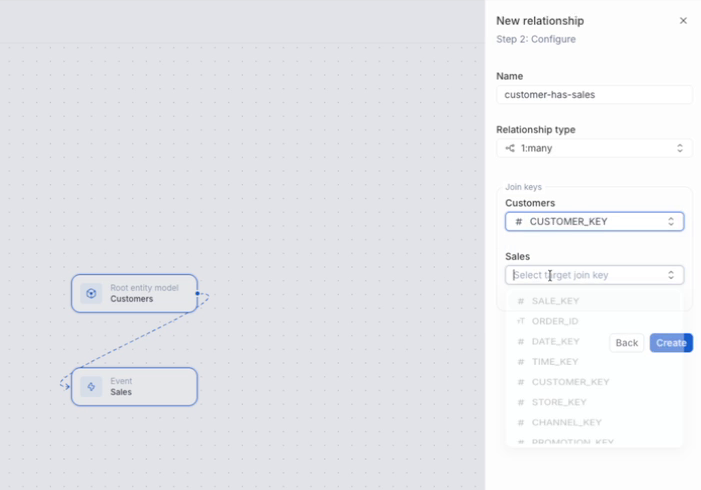
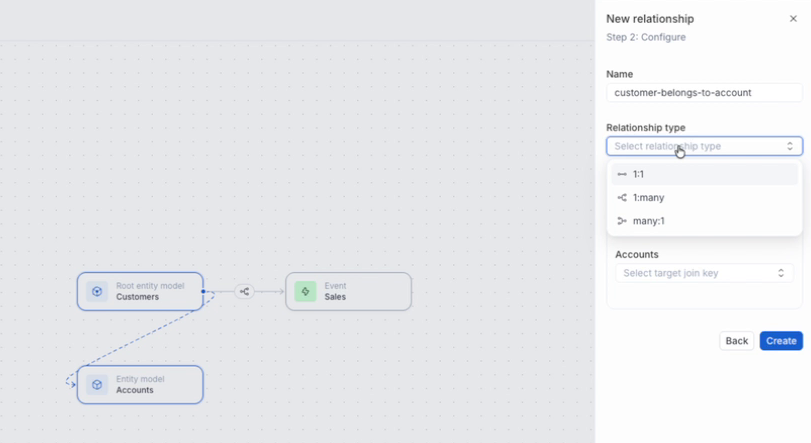
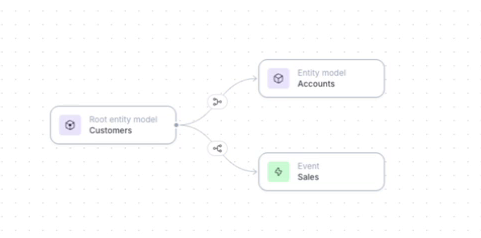
You can continue expanding the data graph with more entity and event models and relationships.
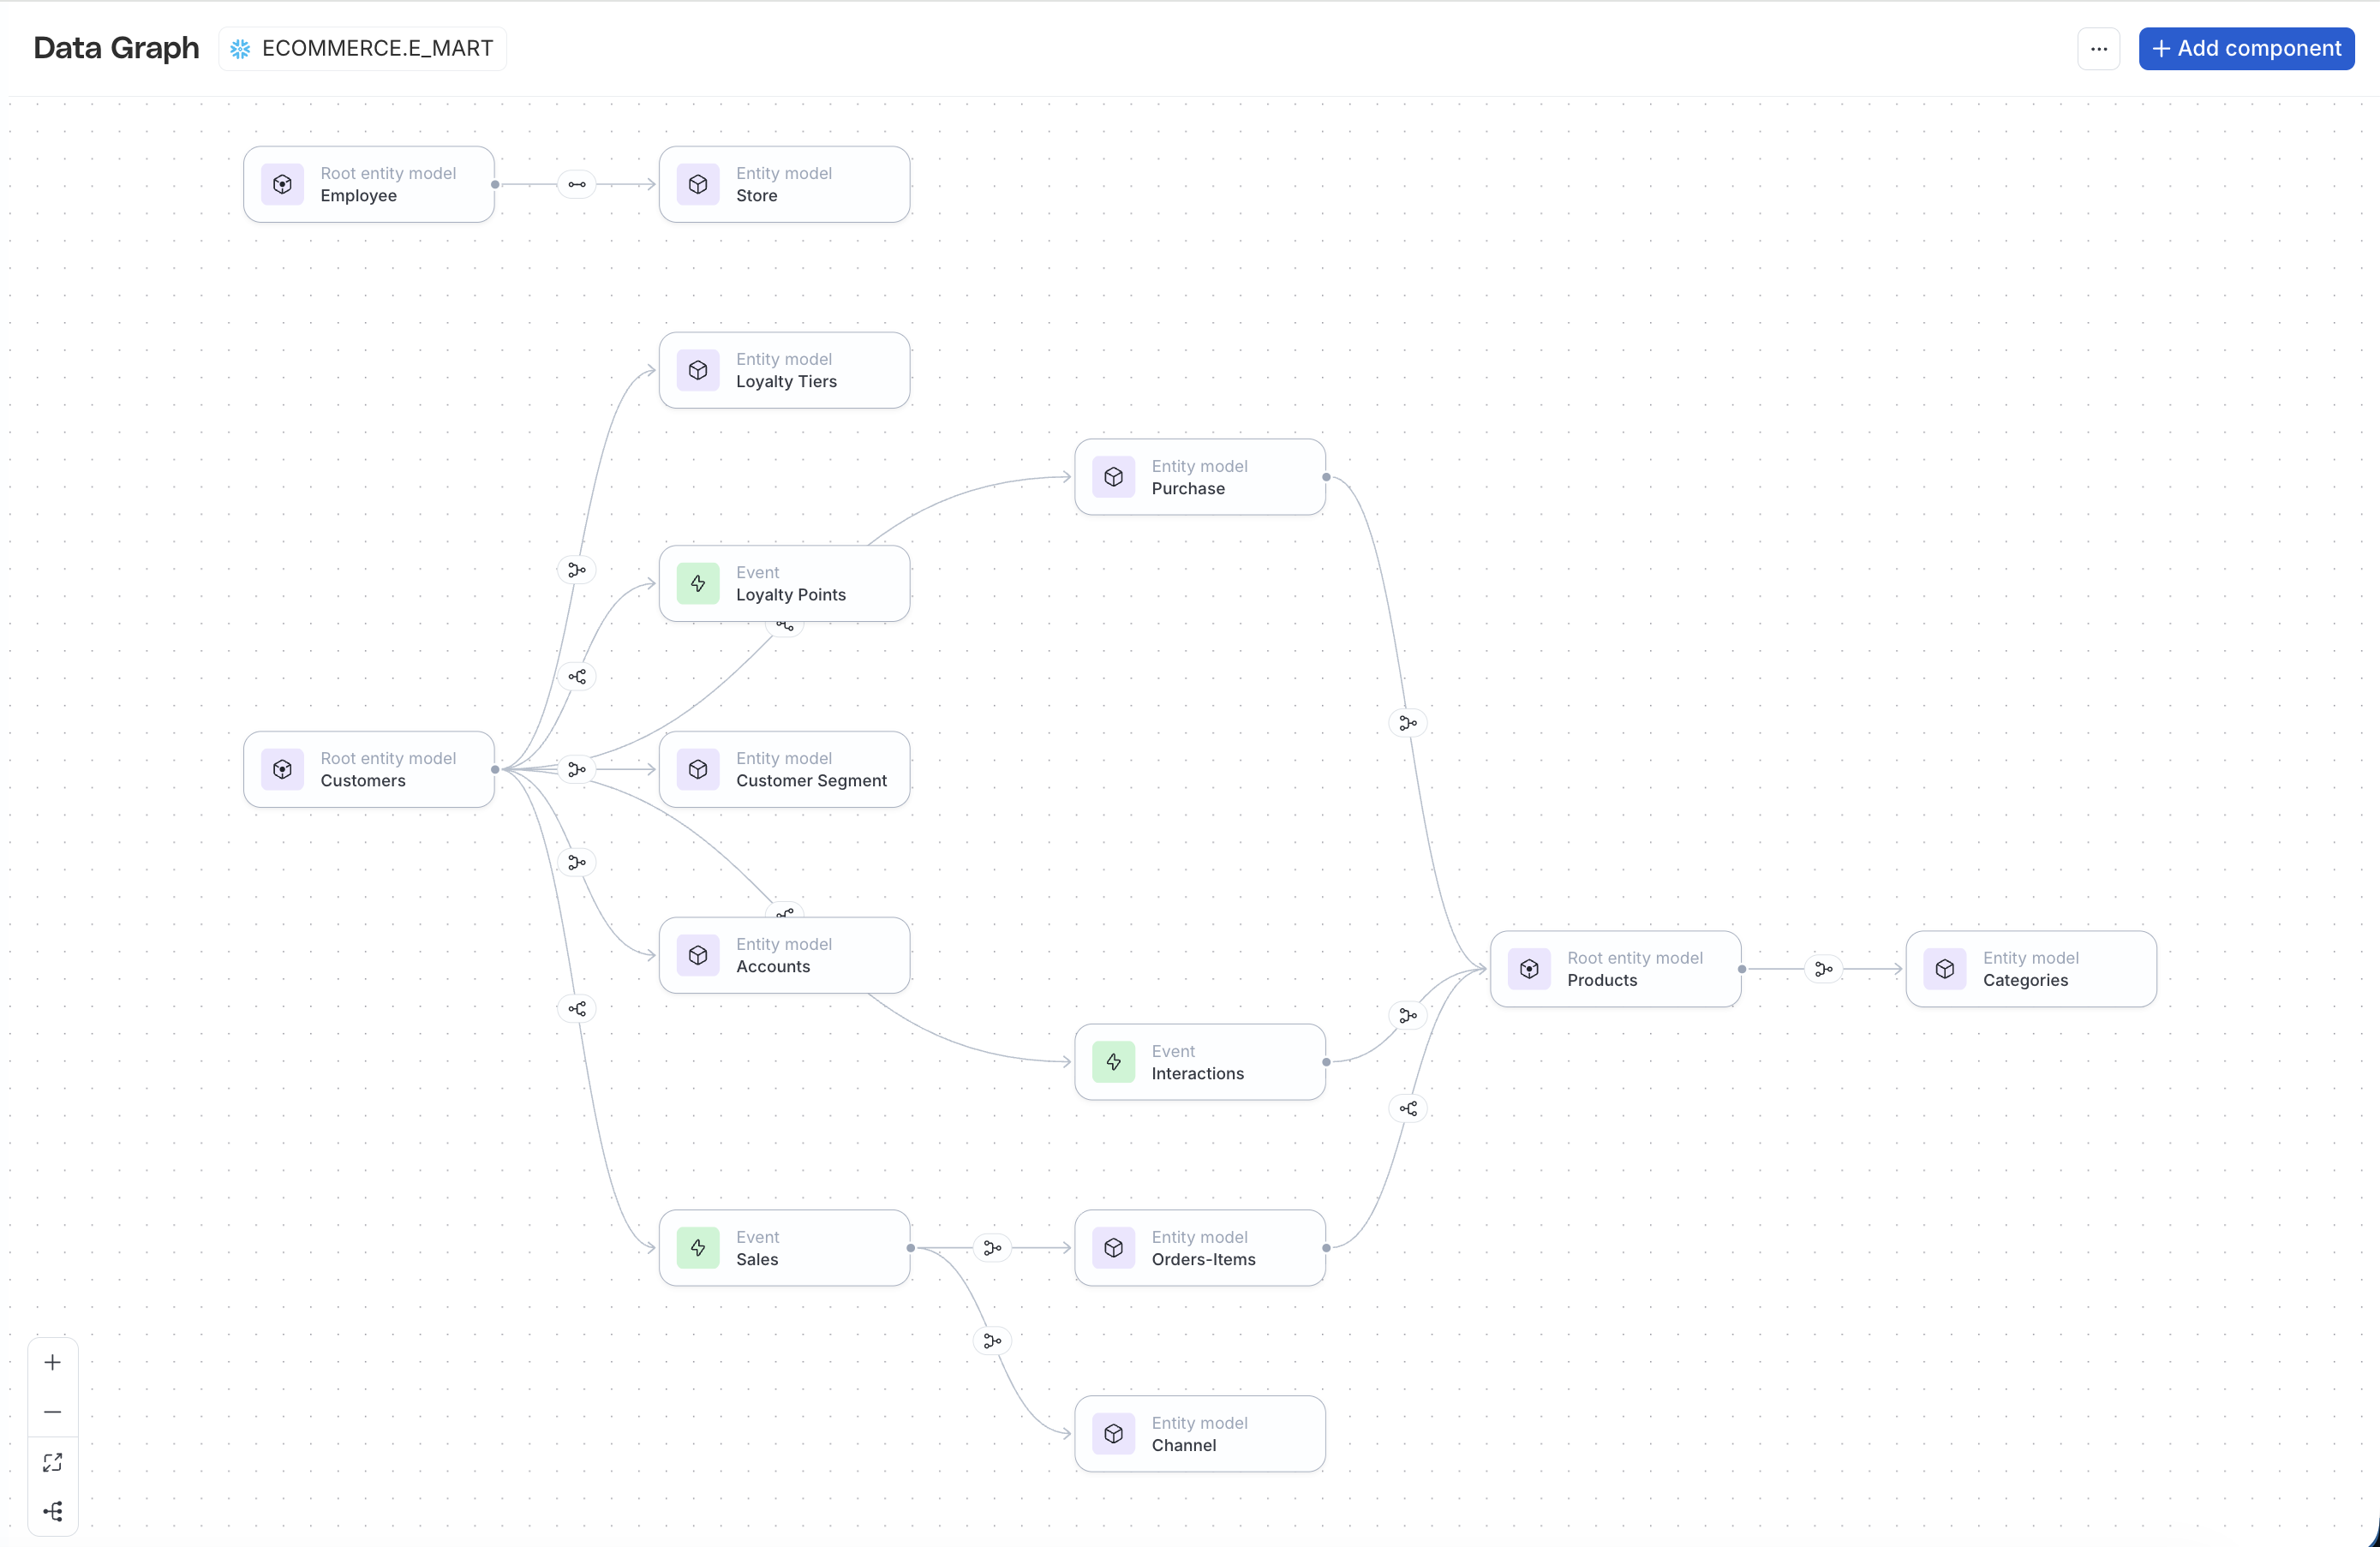
Once the data graph is created, the models may appear scattered on the canvas. Use the Auto Layout option on the bottom left of the canvas to organize the graph.