You are viewing documentation for an older version.

Propensity Scores
14 minute read
Using Profile’s Propensity Scores Data App, you can predict the likelihood of user actions using machine learning (ML) algorithms. These predictive capabilities enable data-driven decision-making by calculating scores that represent the probability of a user performing a specific action within a predefined timeframe, for example:
- Is a customer likely to churn in the next 30 days?
- Will a user make a purchase in the next 14 days?
- Is a lead likely to convert in the next 7 days?
Use cases
- Reduced churn: Identify users at risk of churning and implement targeted interventions to retain them.
- Increased conversions: Prioritize leads with a higher propensity to convert, boosting your marketing campaign effectiveness.
- Improved resource allocation: Focus resources on high-value user segments for maximized impact.
Prerequisites
- An active RudderStack Profiles project (v0.18.0 or above) using a Snowflake, BigQuery, or Redshift warehouse.
- (Optional) If you are using Snowflake, you might need to create a Snowpark-optimized warehouse if your dataset is significantly large.
- Install the
profiles-mlcoreliblibrary in your Python environment (version 3.9.0 to v3.11.10) usingpip install profiles-mlcorelib. Note that it should be the same Python environment as theprofiles-rudderstacklibrary.
RudderStack strongly recommends using an isolated and clean Python virtual environment.
Update your
pb_project.yamlfile to include the library:yamlpython_requirements: - profiles_mlcorelib>=0.6.0
Project setup
The following steps guide you on how to set up a propensity model to generate propensity scores within an existing Profiles project:
Step 1: Define the label (prediction target)
Identify and define the action you want to predict (also known as label), for example, inactivity churn, subscription churn, a lead conversion, payer conversion, reactivation, etc.
Let’s assume you want to predict whether a user will pay for your product. You can create a label named is_payer which takes the value as true for users who have paid and false for those who haven’t.
A sample entity_var definition of is_payer label will be:
entity_var:
    name: is_payer
    select: case when user.revenue > 0 then 1 else 0 end
Label data types
For propensity modeling, the data type must be Boolean or Binary, that is, the label must have only two distinct values like 0/1, true/false, yes/no, etc.
Although not the primary focus on the Propensity model, it can also be used to predict numeric values. In that case the label is a continuous numeric value.
This can be used, for example, for predictions like predicted LTV or predicted purchase total in the next 30 days.
Step 2: Define the relevant entity_vars
You need to specify the user set for model training. For example, you can define following entity_vars that may predict whether a user is likely to spend anything in future:
- Number of days since the user was last seen
- Number of user sessions
- entity_var:
    name: days_since_last_seen
    select: "{{macro_datediff('max(timestamp)')}}"
    from: models/rsPages
- entity_var:
    name: n_sessions
    select: count(distinct session_id)
    from: inputs/rsPages
    default_value: 0
Some entity_vars may not directly depend on the label and you may not want to train the model on all the users. Define the entity_vars for an eligible user set. For example, to predict a user’s likelihood of paying for a product, define the following features:
- New users who created their account within the past 30 days.
- Users belonging to US.
- Users who haven’t made any purchases so far.
- entity_var:
    name: days_since_account_creation
    select: "{{macro_datediff('min(timestamp)')}}"
    from: models/identifies
- entity_var:
    name: country
    select: any_value(country)
    from: models/identifies
- entity_var:
    name: revenue
    select: sum(amount_spent)
    from: inputs/orderCompleted
    default_value: 0
Ensure that the
entity_varsfor features and label originate from input tables with a definedoccured_at_colvalue.This enables Profiles to correctly materialize past data while considering specific timeframes. Without this, you might get overly optimistic models with misleading metrics.
Step 3: Set the prediction window
Define the time frame within which you want to predict the user behavior. The predict_window_days setting determines this period, for example, you might want to predict churn within the next 30 days.
The value for predict_window_days is use case-dependent. For instance, a daily-use game might benefit from a 7-day churn prediction window, while a monthly subscription service might require a 3-month window.
A sample profiles.yaml with propensity model type and predict_window_days setting:
models:
    - name: payer_propensity_model
      model_type: propensity
      model_spec:
          inputs:
              - entity/user/days_since_account_creation
              - entity/user/days_since_last_seen
              - entity/user/revenue
              - entity/user/is_payer
              - entity/user/country
              - entity/user/n_sessions
          training:
              predict_var: entity/user/is_payer
              label_value: 1
              predict_window_days: 30
              eligible_users:  days_since_account_creation <= 30 and country = 'US' and revenue = 0
Note that:
- All the features and label used by the model (defined as
entity_vars), are provided as a list ininputs. - RudderStack appends the value of
eligible_userskey to an SQL query, forming a query likeselect * from user_var_table where <eligible_users>. Hence, you must define all the columns used ineligible_userskey asentity_vars.
Step 4: Name the predictive features
Specify the features you want to predict within the prediction block. Here’s an example for predicting the payer propensity:
prediction:
    output_columns:
        percentile:
            name: payer_propensity_percentile
            description: Percentile score of a user's likelihood to pay in the next 30 days
        score:
            name: payer_propensity_probability
            description: Probability score of a user's likelihood to pay in the next 30 days
Sample YAML for a predictive feature
After completing the above steps, a complete sample profiles.yaml file for a predictive feature will look as follows:
models:
    - name: payer_propensity_model
      model_type: propensity
      model_spec:
          entity_key: user
          training:
              predict_var: entity/user/is_payer
              label_value: 1
              predict_window_days: 30
              validity: month
              type: classification
              eligible_users: days_since_account_creation <= 30 and country = 'US' and revenue = 0
              max_row_count: 50000
              recall_to_precision_importance: 1.0
              new_materialisations_config:
                  strategy: auto
                  feature_data_min_date_diff: 14
                  max_no_of_dates: 3
                  dates:
                      - '2024-01-01,2024-01-08' # (feature_date, label_date)
                      - '2024-02-01,2024-02-08'
                      - '2024-03-01,2024-03-08'
              ignore_features:
                  - country
          prediction:
              output_columns:
                  percentile:
                      name: payer_propensity_percentile
                      description: Percentile score of a user's likelihood to pay in the next 30 days
                  score:
                      name: payer_propensity_probability
                      description: Probability score of a user's likelihood to pay in the next 30 days
                      is_feature: False
              eligible_users: '*' # (Optional) Defaults to what's in training.
          inputs:
              - entity/user/days_since_account_creation
              - entity/user/days_since_last_seen
              - entity/user/revenue
              - entity/user/is_payer
              - entity/user/country
              - entity/user/n_sessions
You can setup multiple predictive features within the same Profiles project by repeating the whole block for each predictive feature.
The following table explains the fields used in the above file:
| Field | Description |
|---|---|
nameRequired | Name of the model. |
model_typeRequired | Model type. Set this to propensity. |
model_specRequired | Detailed configuration specification for the model. |
entity_keyRequired | Entity to be used. |
trainingRequired | Configuration used for training. |
predict_varRequired | entity_var for which you want make predictions. |
label_valueRequired | Value of label column for which prediction needs to be generated. |
predict_window_daysRequired | Time period within which you want to predict the user behavior. |
validityRequired | Time period to re-train the model. Allowed values are: day, week, month.Re-training helps keep the model up-to-date with changing user behavior. But it comes with the cost of increased compute time and resource usage. So its preferable to keep the validity longer (for example, month) if you expect the user behavior doesn’t change too frequently. |
type | Tells the model whether you are trying to predict a boolean feature (for example, yes/no, churned/not_churned, converted/not_converted, etc.), or a numeric feature (for example, amount_spent). If it is a boolean feature, the type should be classification. If it’s numeric, type should be regression. It defaults to classification if not specified. So, you can skip this parameter if you are predicting churn, subscription, etc. |
eligible_users | User set for model training. RudderStack appends the value of eligible_users key to an SQL query, forming a query like select * from user_var_table where <eligible_users>. Hence, you must define all the columns used in eligible_users key as entity_vars.If not provided, it defaults to users who have predict_var != label_value during feature generation period, that is, it generates propensity scores for all the users who have not yet converted in the feature generation period. |
max_row_count | Maximum samples to be used for ML training. However, the actual number of used samples depend on the availability. Defaults to 500,000. |
recall_to_precision_importance | An advanced feature that adjusts the balance between false positives and false negatives in the model’s output. If reducing false positives is more important, set the value closer to 0 (for example, 0.3). If reducing false negatives is the priority, use a value greater than 1 (for example, 3.0). False positives are costly when it leads to unnecessary actions, such as sending a promo code to loyal users incorrectly identified as at risk of churning. On the other hand, false negatives are more problematic when missing out on targeting someone could lead to a permanent loss, such as a subscription customer who churns and never returns. If you’re unsure about which to prioritize, you can leave the value at the default of 1.0 (or simply omit the parameter, and the model will automatically set it to 1.0). |
new_materialisations_config | This block lets you configure the training data for model in case there is not enough data. See FAQ for more information. |
ignore_features | List of entity_var names that are a part of the inputs but should be ignored by the model. This usually happens when your input is a feature_table model, or an SQL model where there are too many defined features for purposes unrelated to the predictive features. |
predictionRequired | Configuration used for prediction. It mainly lists the names of output columns and eligible users for whom predictions are to be generated. |
output_columnsRequired | Configuration for output columns to be generated. |
percentileRequired | Configuration of the column in output table having percentile score. |
nameRequired | Name of the column in output table having percentile score. |
descriptionRequired | Custom description for the percentile column. |
scoreRequired | Configuration of the column in output table having probabilistic score. |
nameRequired | Name of the column in output table having probabilistic score. |
descriptionRequired | Custom description for the score column. |
is_featureRequired | If set to False, this feature won’t be available in final C360 table. Defaults to True. |
inputsRequired | List of input models and entity_vars used by the model.You must include the label column and vars used in eligible_users definition here along with the list of features that the model uses to train. |
Step 5: Run your project
After configuring your project, you can run it using one of the following methods:
Using Profile CLI
If you have created your Profiles project locally, run it using the pb run CLI command to generate the output tables.
Using Profiles UI
Run your Profiles project by first uploading it to a Git repository and then importing it in the RudderStack dashboard.
Output
Once your project run is complete, you can view the following outputs:
Training output
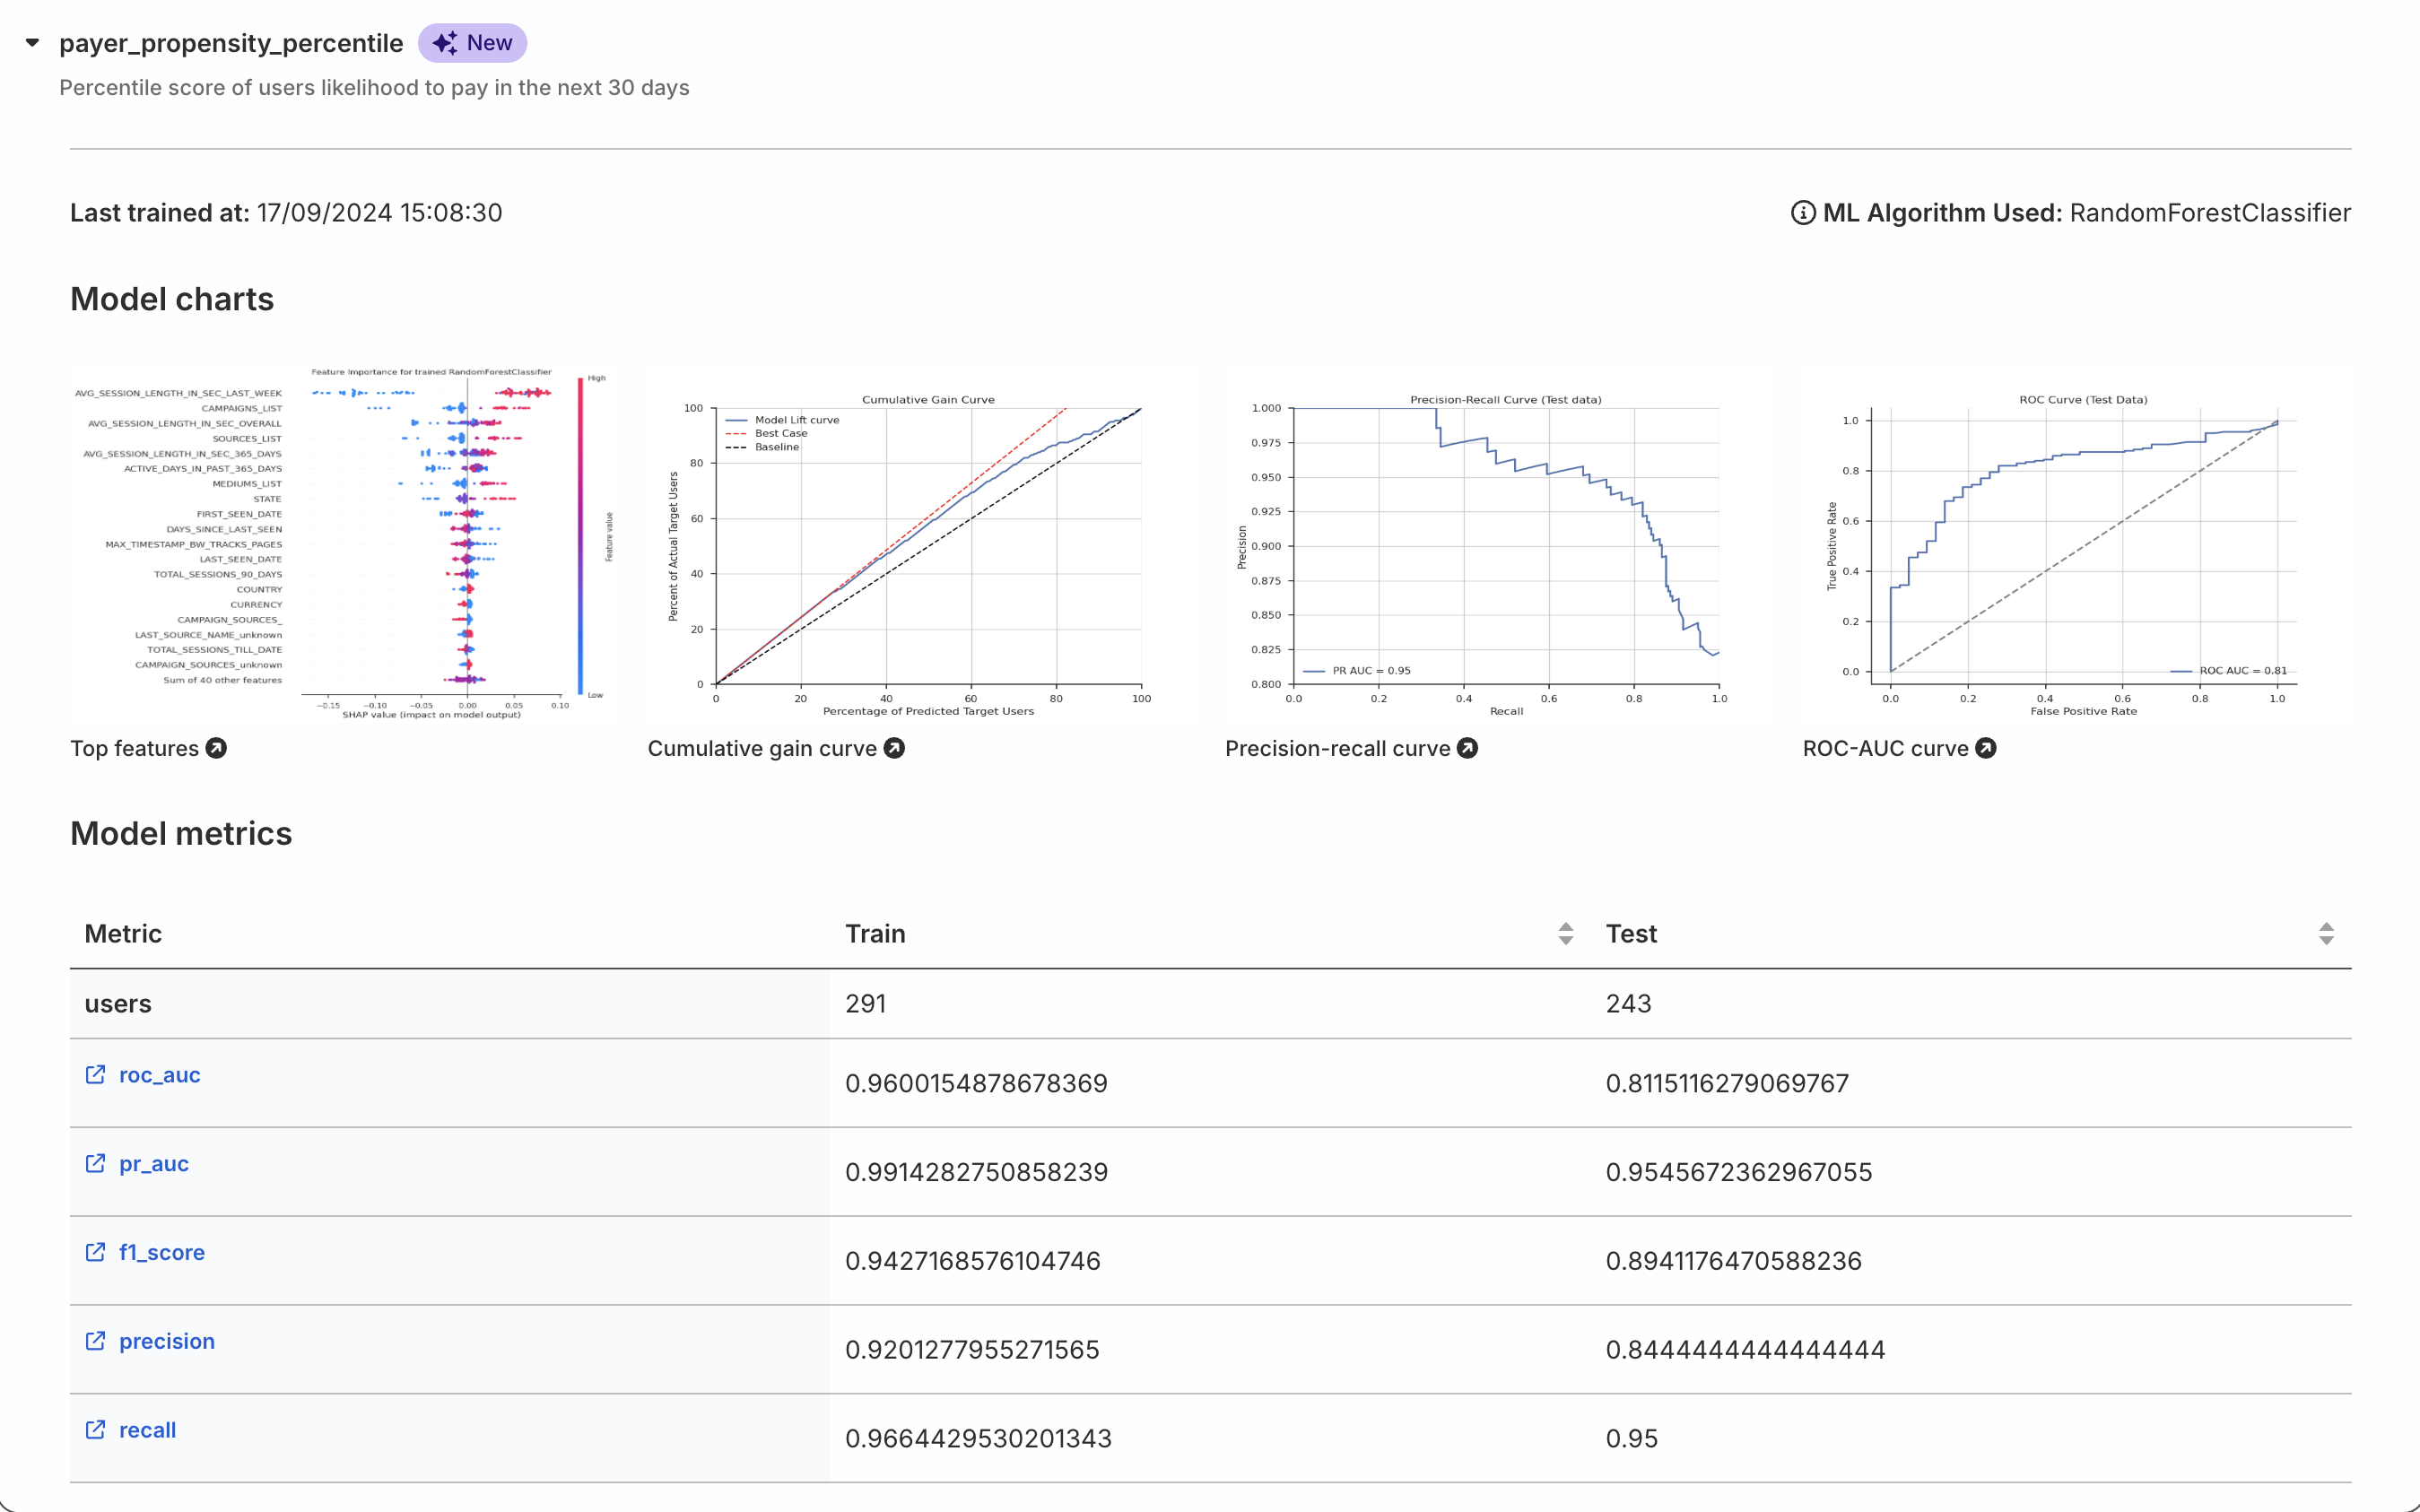
The model generates several outputs based on its training parameters, including charts and a JSON file with metrics. RudderStack stores these artifacts in the outputs folder outputs/seq_no/<seq_no>/run/Material_<model_name><hash>_<seq_no>_reports, for example:
Material_payer_propensity_30_days_<hash>_<seq_no>_reports
  ├── feature-importance-chart.png
  ├── test-lift-chart.png
  ├── test-pr-auc.png
  ├── test-roc-auc.png
└── training_summary.json- Feature Importance Chart: Highlights the key features influencing predictions.
- Cumulative Gain Chart: Provides a visual comparison between the model’s performance and random selection, helping to quantify the model’s ability to identify positive instances efficiently. This chart is particularly useful for optimizing resource allocation in scenarios like marketing campaigns or customer targeting.
- Precision-Recall Curve: Assesses the trade-off between precision and recall at various probability thresholds. It is particularly useful for imbalanced datasets, highlighting the model’s ability to identify positive instances while minimizing false positives.
- ROC Curve: Assesses the trade-off between true positives and false positives. It helps highlight the model’s ability to separate positive and negative labels.
Additionally, RudderStack writes the metrics from the training_summary.json file to a new row in the TRAINING_METRICS_v4 table in your warehouse.
Prediction output
Based on the prediction parameters, Profiles creates a new table in your warehouse. The table’s name is the same as the model along with a hash and seqence number (for example, Material_payer_propensity_30_days_4dd846le_21).
The table contains the following columns, along with the user_main_id:
- Probability score: A value between 0 and 1 indicating the likelihood of a user action, like making a purchase.
- Percentile score: A scaled version of the probability score useful for targeting specific user segments, for example, the top 10% for a campaign.
- Boolean flag: A true/false indicator of whether a user is likely to perform the action, based on the model’s confidence.
The above columns are essentially the same, only represented in different forms. They represent the same prediction in different formats, catering to various use-cases/levels of granularity and interpretation preferences.
View output
You can either:
- View the output materials in your warehouse, OR
- If your Profiles project is in the RudderStack dashboard:
Check the predicted value for any given user in the Profile Lookup section.
Explore predictive features in the Entities tab of your Profiles project.
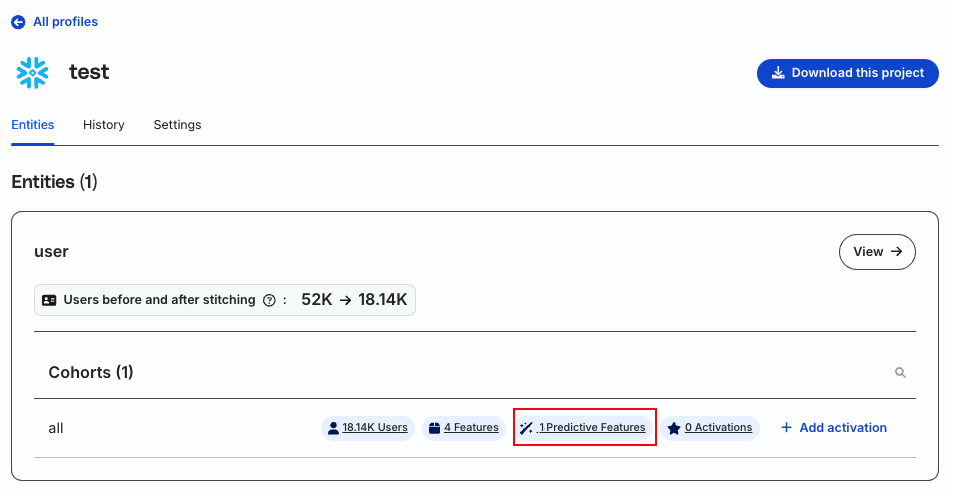
Click Predictive features to see the following view:
Use existing feature setup
You can even use an existing feature table set up outside of Profiles (say, any dbt or SQL project) to generate propensity scores. To do so, you need to provide the existing features as inputs via SQL models. The SQL model serves as a wrapper for your feature table.
Note the following specifications for using SQL models:
- Define the feature table where original features are defined as an input model. Ensure that the
is_event_stream: true, andoccurred_at_colis specified. This enables creating feature snapshots at different points in the past. To support this, the feature table should retain the output from old runs as well. As your external pipeline creates new feature table snapshots daily, they should not replace the old data. Ideally, a fresh run should append new data to the same table. But if each job creates a new table, you can union all such tables to create a view. Make sure you have a timestamp column that denotes when the job was run. - The output of the SQL model should have a single row per user.
- Ensure that column names in the SQL model are unique even if the SQL models are combined with other input types, such as
entity_var. - The SQL model table should already include the entity’s main id column, for example,
user_main_id.
Here’s an example to configure SQL models:
# Define the dbt generated feature table in inputs.yaml
inputs:
  - name: rsFeatureTable
    contract:
      is_optional: false
      is_event_stream: true
      with_entity_ids:
        - user
      with_columns:
        - name: timestamp
        - name: user_id
    app_defaults:
      table: user_features
      occurred_at_col: timestamp
      ids:
        - select: "user_id"
          type: user_id
          entity: user

# Define an id stitcher over this, so the table gets a user_main_id column attached

models:
  - name: rs_id_stitcher
    model_type: id_stitcher
    model_spec:
      entity_key: user
      edge_sources:
        - from: inputs/rsFeatureTable

# Define an SQL model on top of this
models:
  - name: rsFeatureTableSnapshot
    model_type: sql_template
    model_spec:
      single_sql: |
        {% with feature_table = this.DeRef("inputs/rsFeatureTable/var_table") entity_id = this.DeRef("inputs/rsTracks/rsFeatureTable/user_main_id") %}
            select a.{{entity_id}}, f1, f2, f3 from
            (
              select  * from {{feature_table}} where
              timestamp <= '{{end_time.Format(\"2006-01-02 15:04:05\")}}'
            ) a inner join
            (select {{entity_id}}, max(timestamp) as max_timestamp from {{feature_table}} where
              timestamp <= '{{end_time.Format(\"2006-01-02 15:04:05\")}}'
              group by {{entity_id}}) b on
              a.{{entity_id}} = b.{{entity_id}} and a.timestamp = b.max_timestamp
        {% endwith %}
      ids:
        - select: "user_id"
          type: user_id
          entity: user
          to_default_stitcher: true
      contract:
        is_optional: false
        is_event_stream: false
        with_entity_ids:
          - user
        with_columns:
          - name: user_id
FAQ
How does the model select data for training?
For training the ML models, RudderStack needs a minimum of 5000 samples. If the model finds that there fewer than 5000 samples, RudderStack materializes more training data by running the Profiles project at different timestamps in the past. There are two materialization strategies: auto or manual.
auto strategy
The strategy parameter in the new_materialisations_config block specifies the strategy for generating new materials. It is set to auto by default, where the model creates upto 3 pairs of materials (total 6) where each pair is 2 weeks (14 days) apart by default. RudderStack starts with the most recent data, and keeps going back 14 days, till there is enough training data (5000 samples).
Additionally, you can use the below parameters to adjust the default behavior:
max_no_of_dates: Specifies the number of materials to be generated. The default value is 3 pairs.feature_data_min_date_diff: Specifies the minimum number of days between newly generated materials and existing materials. The default value is 2 weeks (14 days).
manual strategy
In this case, you can mention the dates from where the training pairs should be generated using the following parameter:
dates: Uses exact dates to generate the feature and label pairs.
Which features should I use as inputs to the model?
RudderStack recommends using features that help you build an effective model and solve your business problem. The commonly used features can be the ones that reflect user behavior and characteristics that influence the outcome you’re predicting. For instance:
- For subscription churn, relevant features may include how long a user has been subscribed and how often they interact with key product features.
- For lead scoring, factors like UTM source, days since sign-up, and engagement with pricing pages may be more relevant.
How can I know if the trained model is good?
Although there is no universal good score for model evaluation metrics, RudderStack uses a few guidelines:
- Feature Importance: The top features in the feature importance chart should align with your expectations. Unexpected features or missing important ones might indicate an issue.
- Cumulative Gain Chart: If the model curve is close to the baseline, the model is likely underperforming.
- ROC-AUC: A score close to 0.5 indicates random performance, while scores closer to 1 indicate better model performance. However, highly imbalanced datasets may yield misleadingly high ROC-AUC scores, so precision should also be considered.
- Train-Val-Test Metrics: Training metrics are usually higher than validation/test metrics. A large gap suggests overfitting. Validation and test metrics should be close to each other.
