# How to Build Dashboards with Rudder Lookout


<blockquote class="announcement">
  <div class="tip-quote">
    
    <div class="tip-text"><strong>Rudder Lookout</strong> is currently in <strong>Public Beta</strong>. <a href="mailto:product@rudderstack.com" >Contact the Product team</a> if you have any questions.</div>
  </div>
</blockquote>

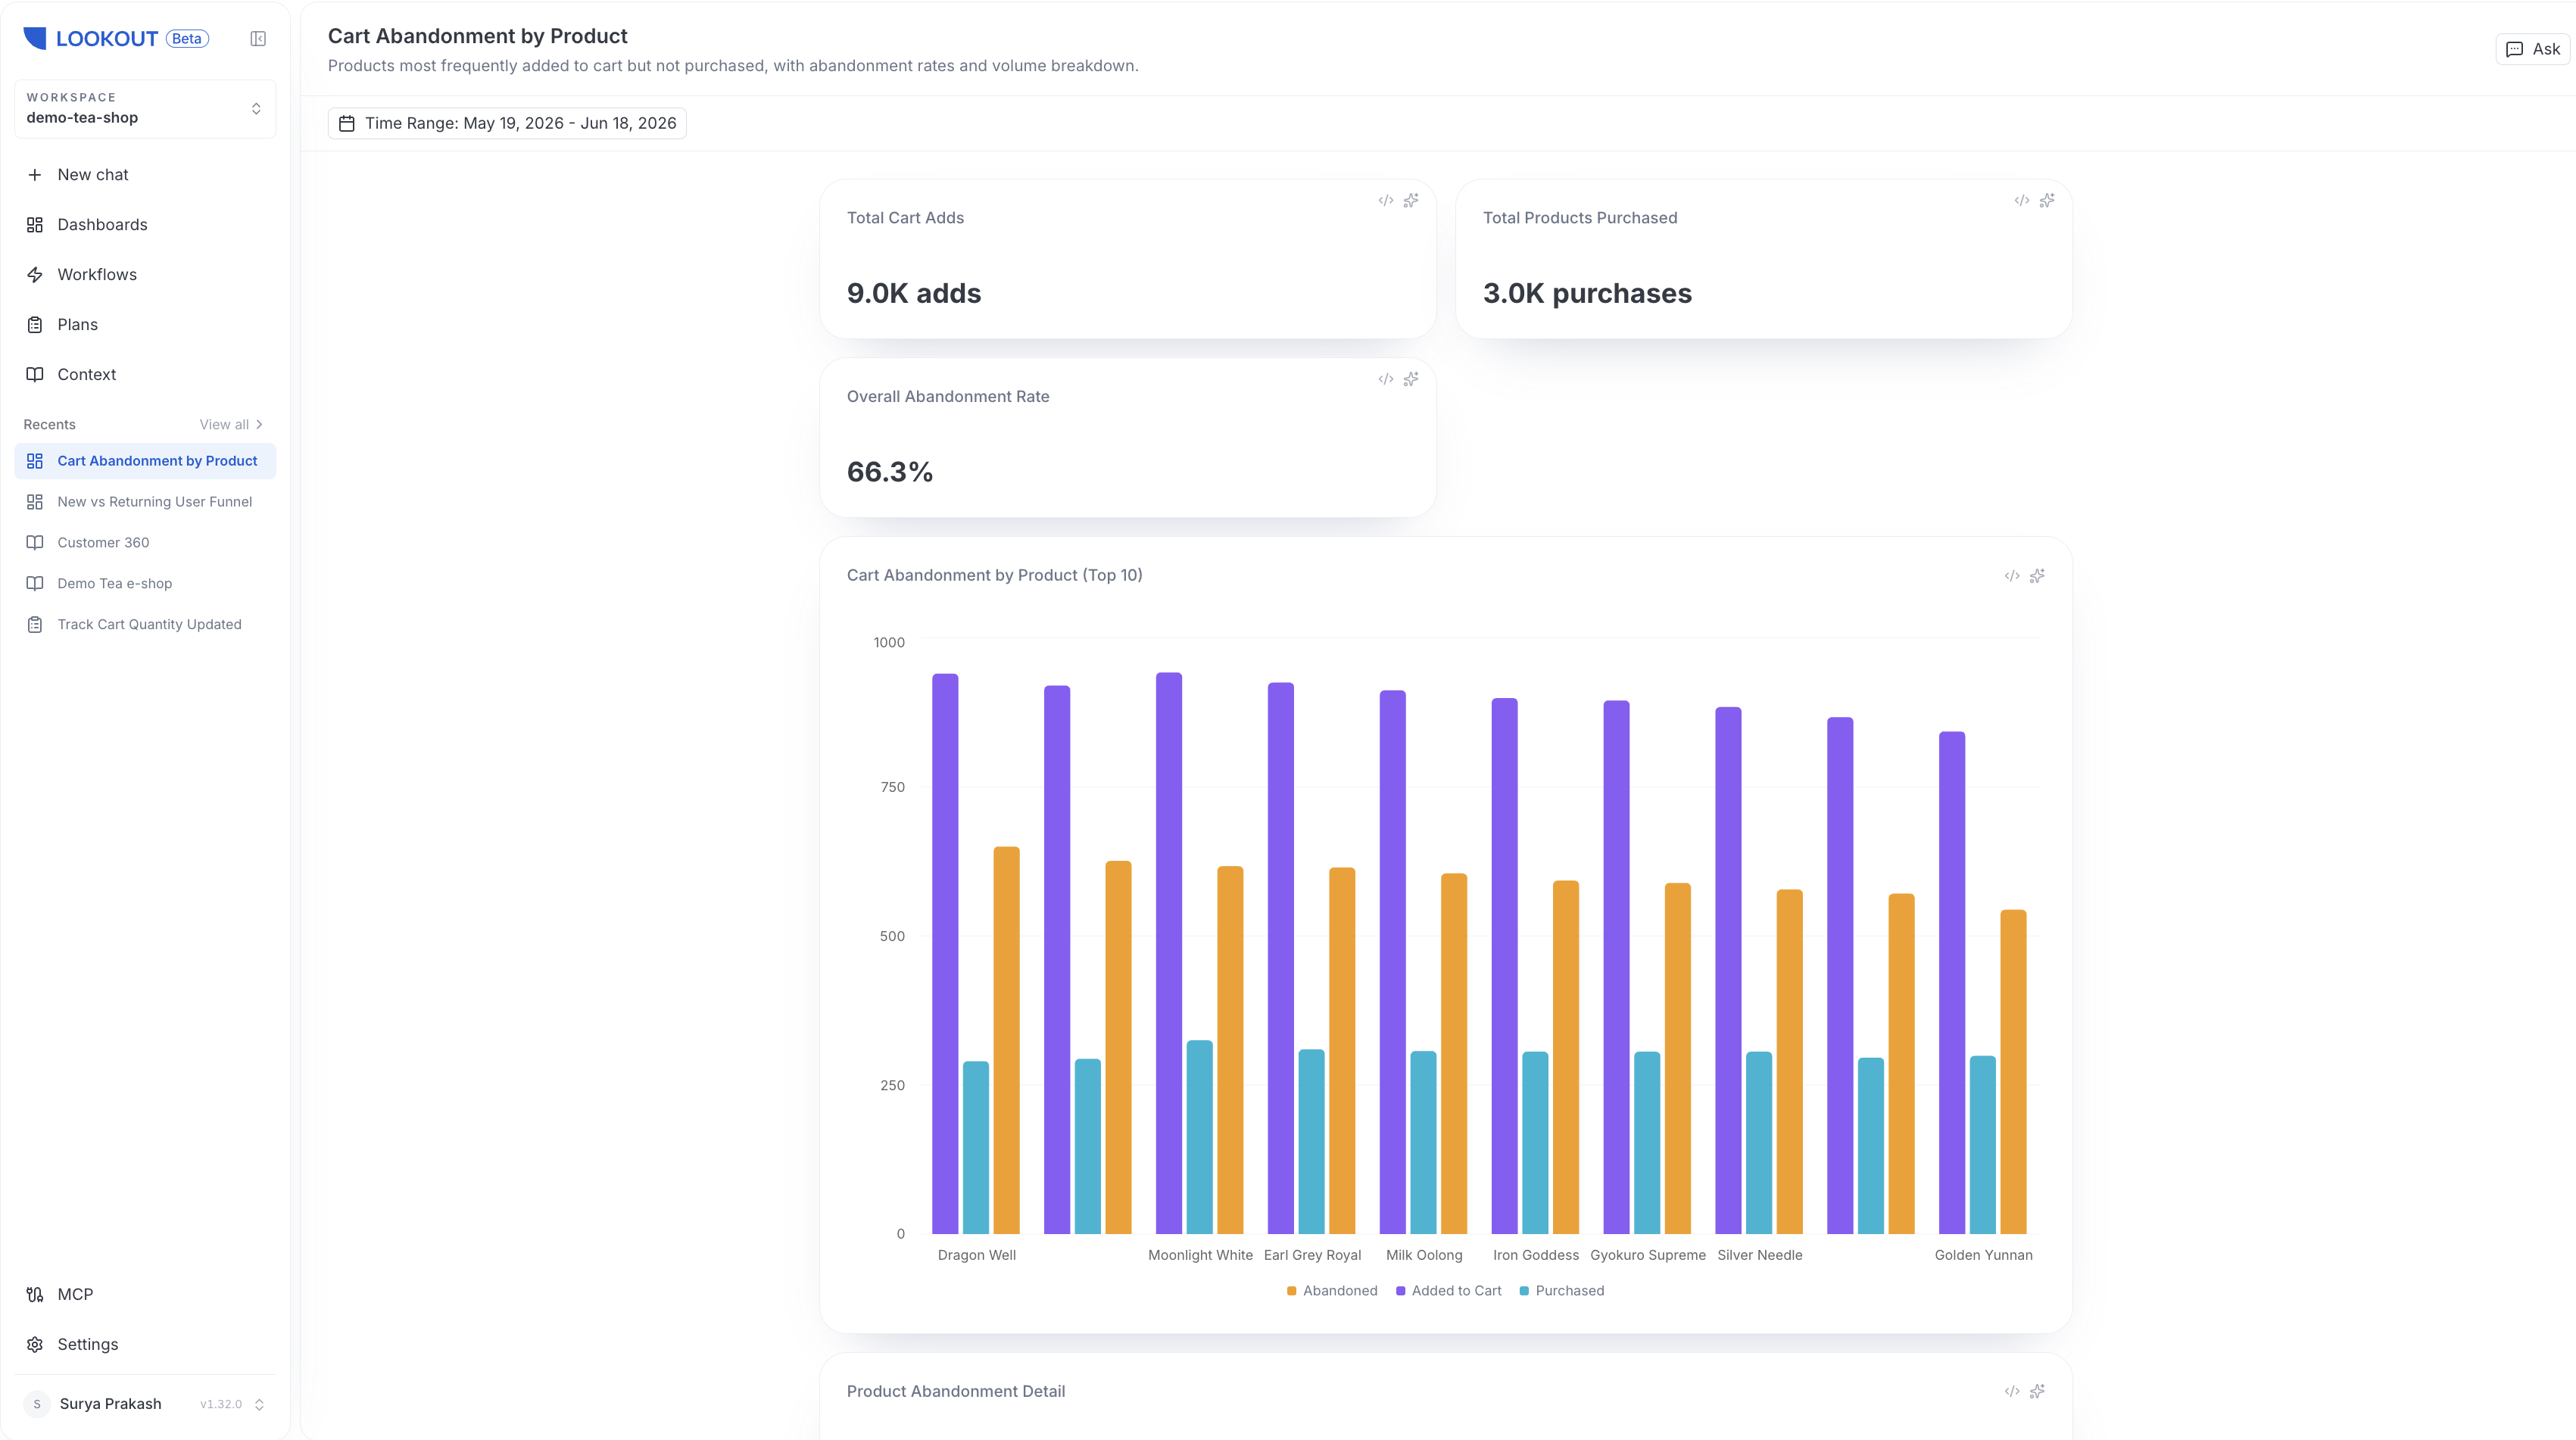
<p>A <strong>dashboard</strong> turns an ad-hoc answer into something your team keeps. Dashboards are built and iterated on in chat, each has its own link inside your workspace, and they re-run their queries fresh on every load — so a dashboard always reflects current data.</p>

<figure class="image--main "  >
    <a 
         href="/docs/images/lookout/dashboard.png"
        
        >
        <img src="/docs/images/lookout/dashboard.png" 
         alt="A Lookout dashboard with metric and chart panels"  
         
         
        decoding="async" loading="lazy" class="img-shortcode"/>
    </a>
    
</figure>

<!-- end-chunk -->
<!-- begin-chunk -->
<h2 id="build-a-dashboard-from-chat">Build a dashboard from chat</h2><p>When an answer is worth keeping, ask the agent to save it as a dashboard panel. The agent writes a dashboard specification, its parameters and panels, and gives it a slug-addressed URL inside your workspace.</p>
<p>You can keep refining a dashboard conversationally — ask the agent to add a panel, change a grouping, or adjust a filter, and it edits the dashboard in place.</p>
<!-- end-chunk -->
<!-- begin-chunk -->
<h2 id="panel-types">Panel types</h2><p>A dashboard is made up of panels. Lookout supports four panel types:</p>
<table>
<thead>
<tr>
<th>Panel</th>
<th><div>Best for</div></th>
</tr>
</thead>
<tbody>
<tr>
<td><strong>Chart</strong></td>
<td>Trends and comparisons over time or across categories</td>
</tr>
<tr>
<td><strong>Table</strong></td>
<td>Row-level detail and breakdowns</td>
</tr>
<tr>
<td><strong>Metric</strong></td>
<td>A single headline number, such as a total or a rate</td>
</tr>
<tr>
<td><strong>Funnel</strong></td>
<td>Step-by-step conversion through a sequence of events</td>
</tr>
</tbody>
</table>
<!-- end-chunk -->
<!-- begin-chunk -->
<h2 id="parameters-and-filters">Parameters and filters</h2><p>Every dashboard carries parameters that let viewers re-scope the data without editing it:</p>
<ul>
<li><strong>Time range</strong>: Always present, so any viewer can change the window the dashboard covers.</li>
<li><strong>Filters</strong>: Optional single-select and multi-select filters you can add to narrow the data.</li>
</ul>
<p>Because dashboards re-run their queries on every load, changing a parameter always pulls current numbers rather than cached ones.</p>
<!-- end-chunk -->
<!-- begin-chunk -->
<h2 id="live-data-nothing-cached">Live data, nothing cached</h2><p>Dashboards store their <strong>definition</strong>, not their data. Each time a dashboard loads, its queries run again against your warehouse, and no result rows are cached. This keeps dashboards current and means your warehouse data stays in your warehouse.</p>
<!-- end-chunk -->
<!-- begin-chunk -->
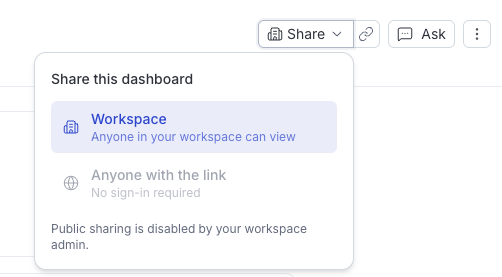
<h2 id="share-dashboards">Share dashboards</h2><p>Every dashboard is visible to everyone in your workspace by default. Use the <strong>Share</strong> menu on a dashboard to confirm workspace visibility or to create a public link.</p>

<figure class="image--main "  >
    <a 
         href="/docs/images/lookout/dashboard-sharing-settings.webp"
        
        >
        <img src="/docs/images/lookout/dashboard-sharing-settings.webp" 


        decoding="async" loading="lazy" class="img-shortcode"/>
    </a>
    
</figure>

<br />