Rudder Lookout is currently in Public Beta. Contact the Product team if you have any questions.
Picking a number for a rule is guesswork until you can see the data behind it. Is “more than 2 orders” a tenth of your customers or nine tenths? Is IN really how the country is spelled, or is it India?
Each rule in an audience can show you. Expand a rule and the agent measures that column in your warehouse and draws what it found underneath — a distribution, a set of value pills, or a set of segments, depending on what kind of column it is. Every control is anchored to real counts, and picking on the control edits the rule.
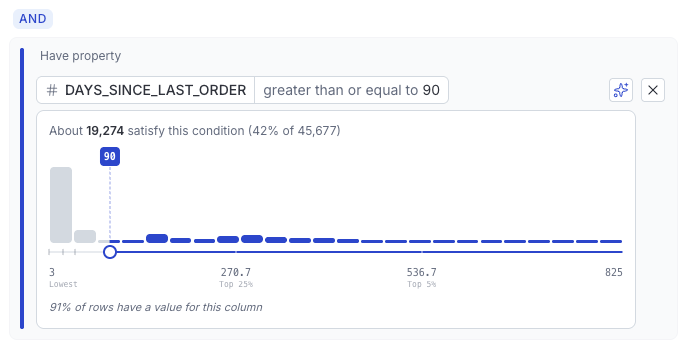
A numeric column — order count, lifetime value, days since last visit — gets a distribution. The bars are buckets of values and their height is how many people fall in each, so the shape tells you where your customers actually sit before you choose a threshold.
Drag a handle to set the threshold, and the shaded region shows what you are keeping. Above the chart, a line reports the consequence:
About 19,274 satisfy this condition (42% of 45,677)
The axis is labeled in words rather than percentiles — Median, Top 25%, Bottom 25% — so you can place a handle against a landmark instead of reading a raw number. On a badly skewed column, where a handful of huge values would flatten everything else into one bar, the chart switches to a scale that spreads the crowded end out. It decides that from the data, not from anything you set.
You can also type an exact value beside the chart when you have a specific figure in mind.
For a column too large to measure bar by bar, the shape is drawn from summary statistics instead, and the readout says the figure is approximate rather than implying a count nobody took.
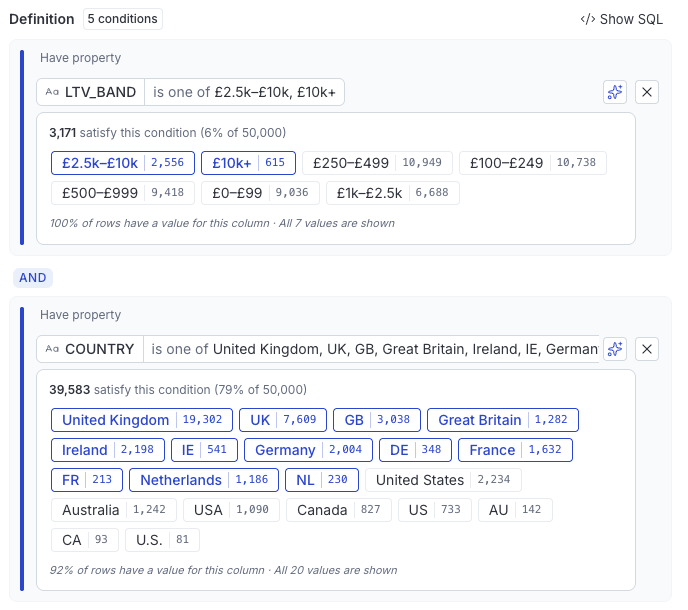
A column with a limited set of values — country, plan tier, channel, a yes/no flag — gets one pill per value, each carrying its own count. Select a pill to use that value; select more than one and the rule widens to match any of them.
Pills spare you the two things that quietly break a rule: guessing at spelling, and guessing at case. If a column holds both india and India, they fold into one pill with a badge saying how many spellings it stands for, and the tooltip lists them.
Where a numeric column has natural bands rather than a smooth spread, you get segments instead — mutually exclusive ranges, one count each. Selecting one applies the whole condition it stands for.
Under every control is one line telling you how much of the data stands behind the picture. It is the difference between a rule that does what you meant and one that quietly drops people. Some examples:
| Example | What it means |
|---|---|
91% of rows have a value for this column |
The rest are blank, and a rule on this column excludes them. |
All 7 values are shown |
The pills are the whole column, so the list is safe to treat as a menu. |
These 10 values cover 94% of rows with a value |
There are more values than are on screen. |
When a measurement is missing, the line stays away rather than showing a zero. An unmeasured column is not an empty one.
Insights describe one column. They tell you how many people satisfy that single condition — not how many end up in the audience once every other rule applies.
For the real figure, refresh the Size in the header. It goes stale as soon as you change anything, which is your cue that the number above no longer matches the rules below.